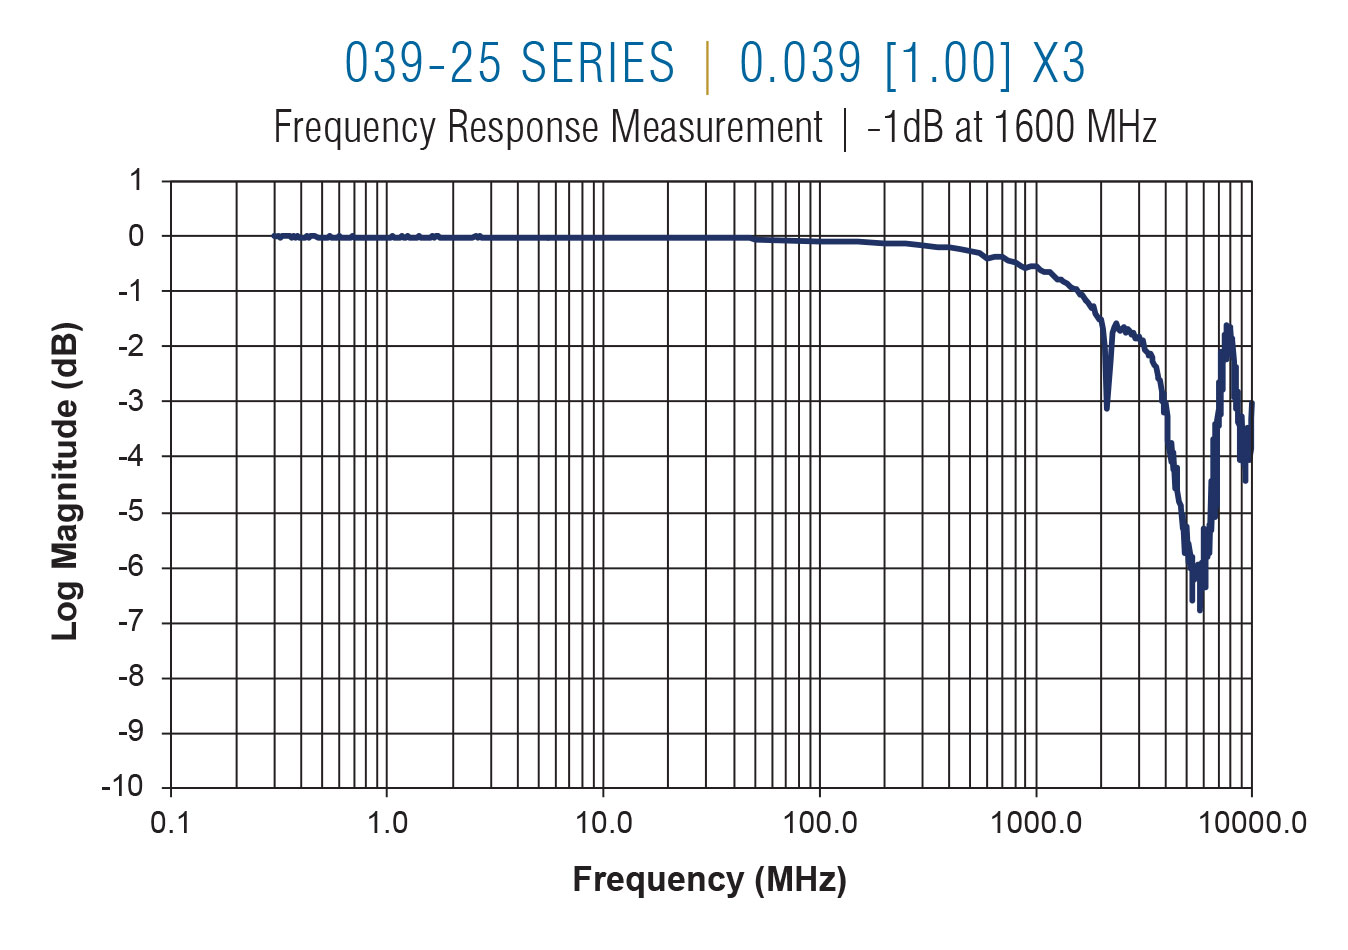
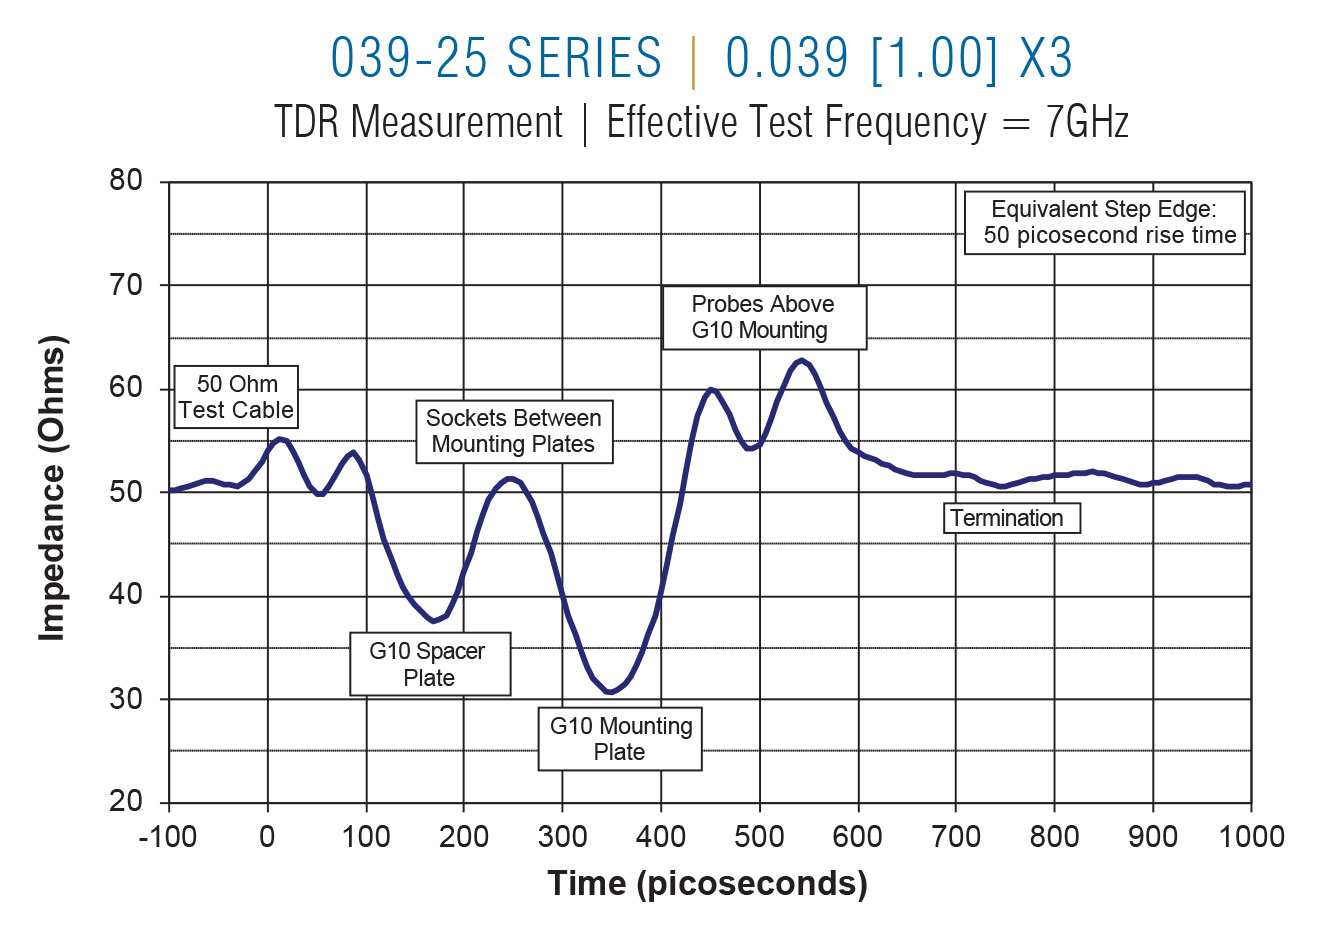
Getting a clean and accurate signal from the tester electronics to the board under test is critical for high-speed testing. Fixture wiring can be a major contributor of distortion and noise in the signal transmission path. To better understand the possibilities of wireless fixturing, QA Technology examined the high frequency performance of wireless socket and termination pins and probes.
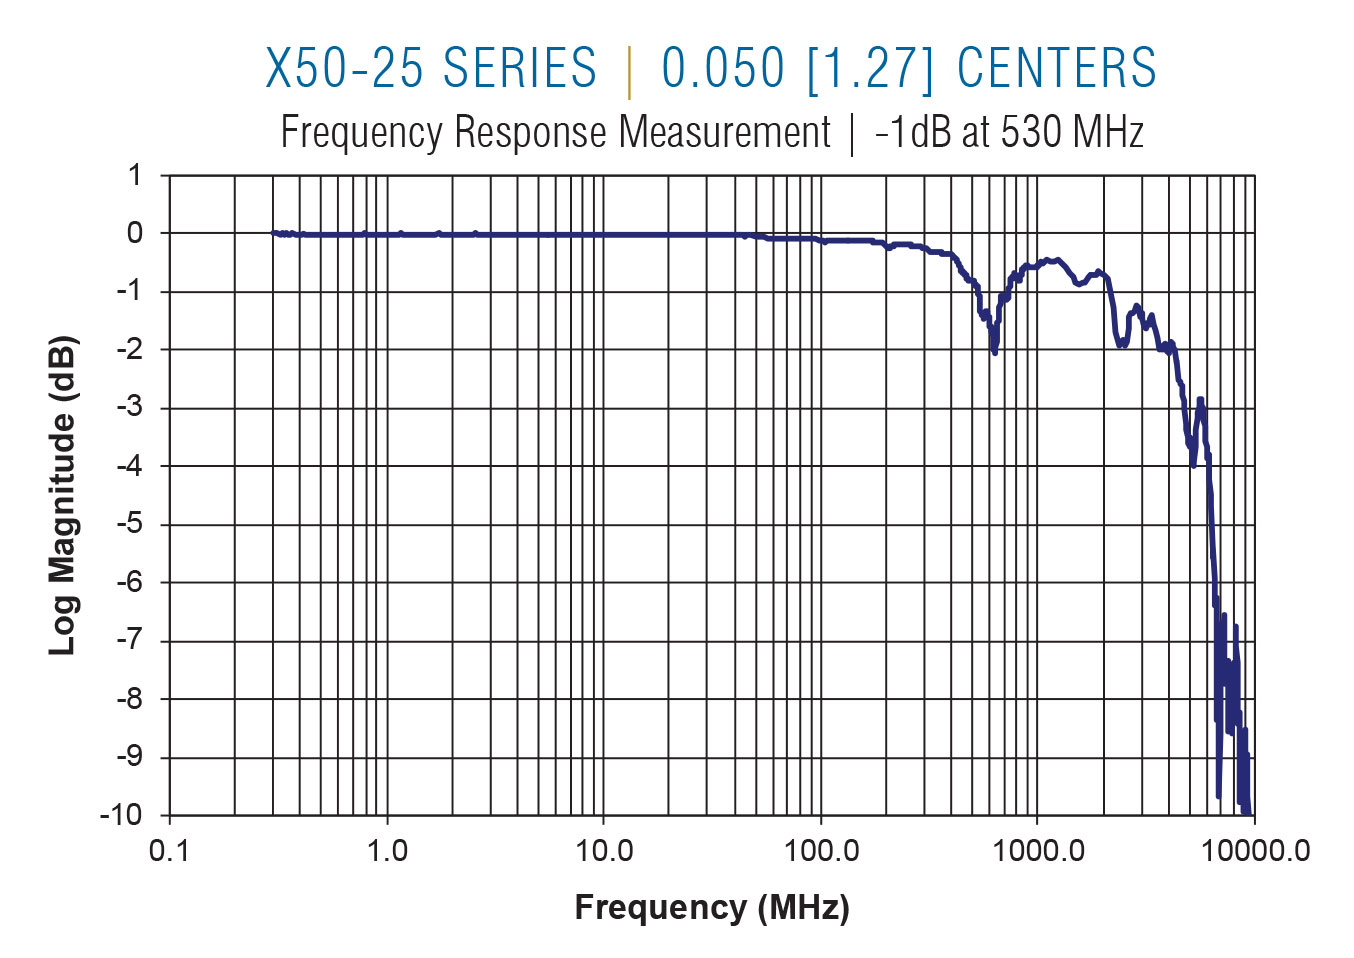
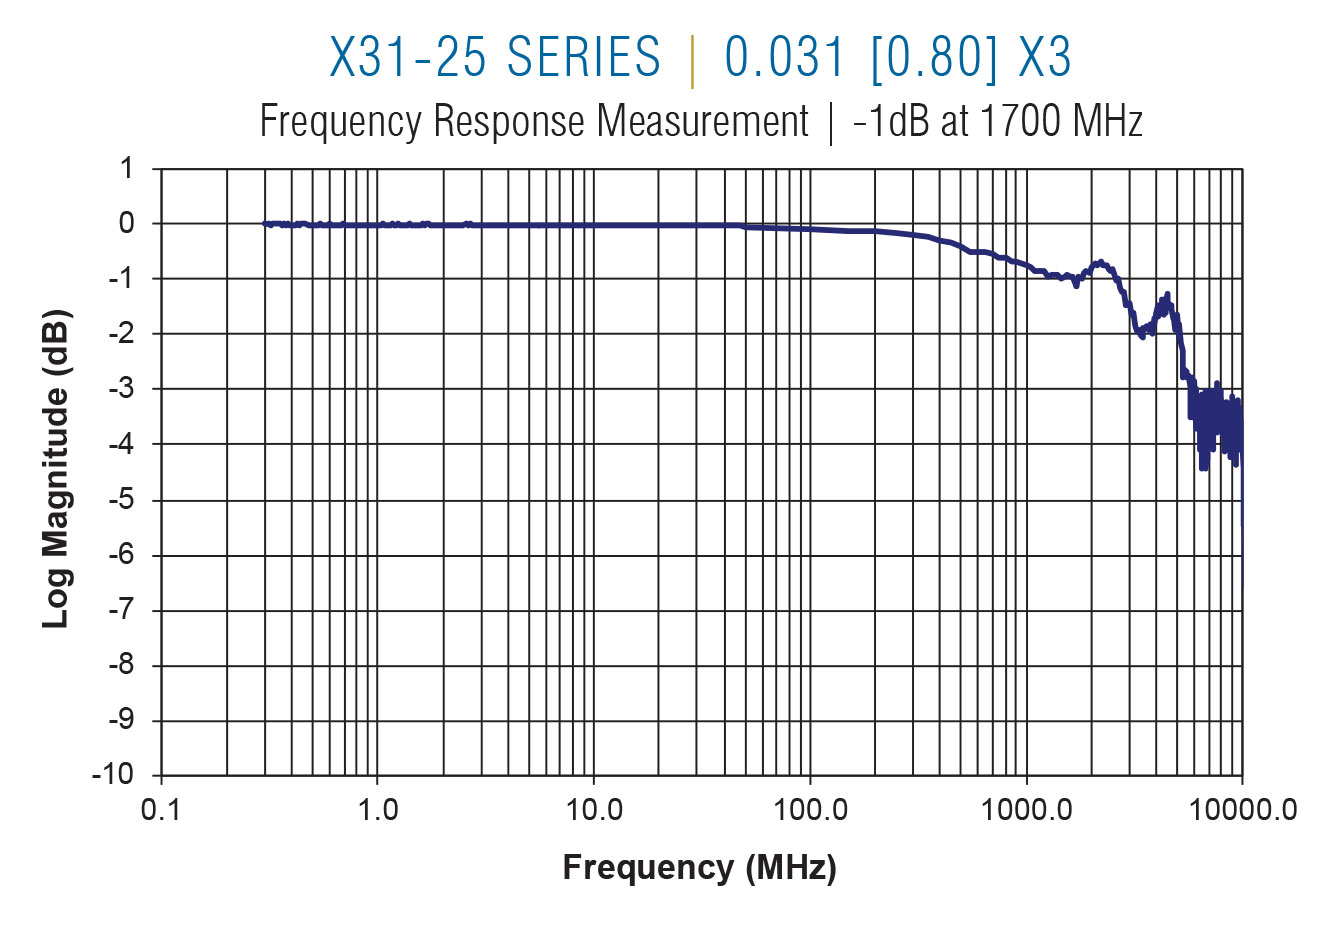
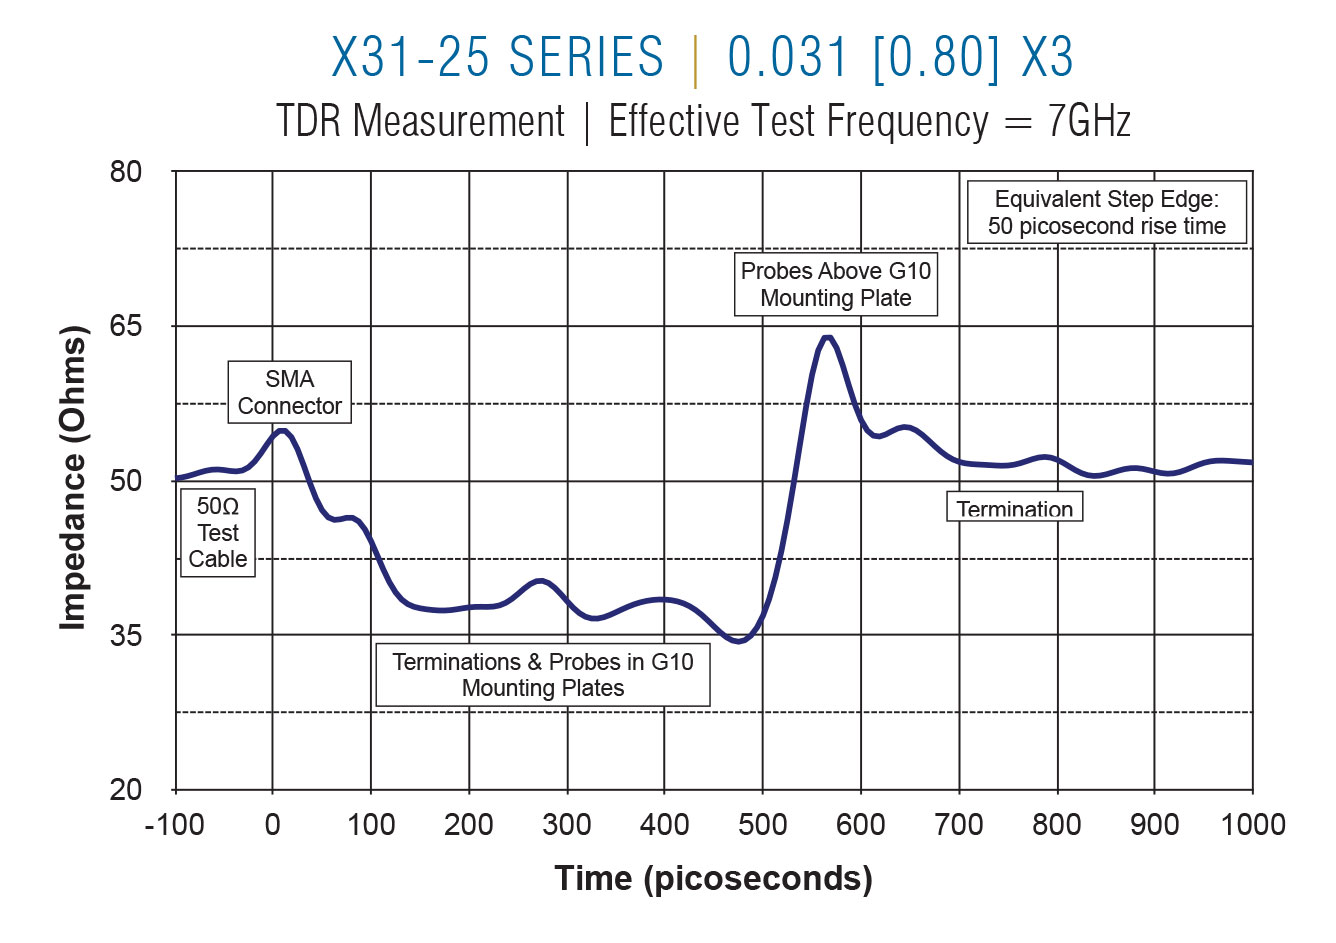
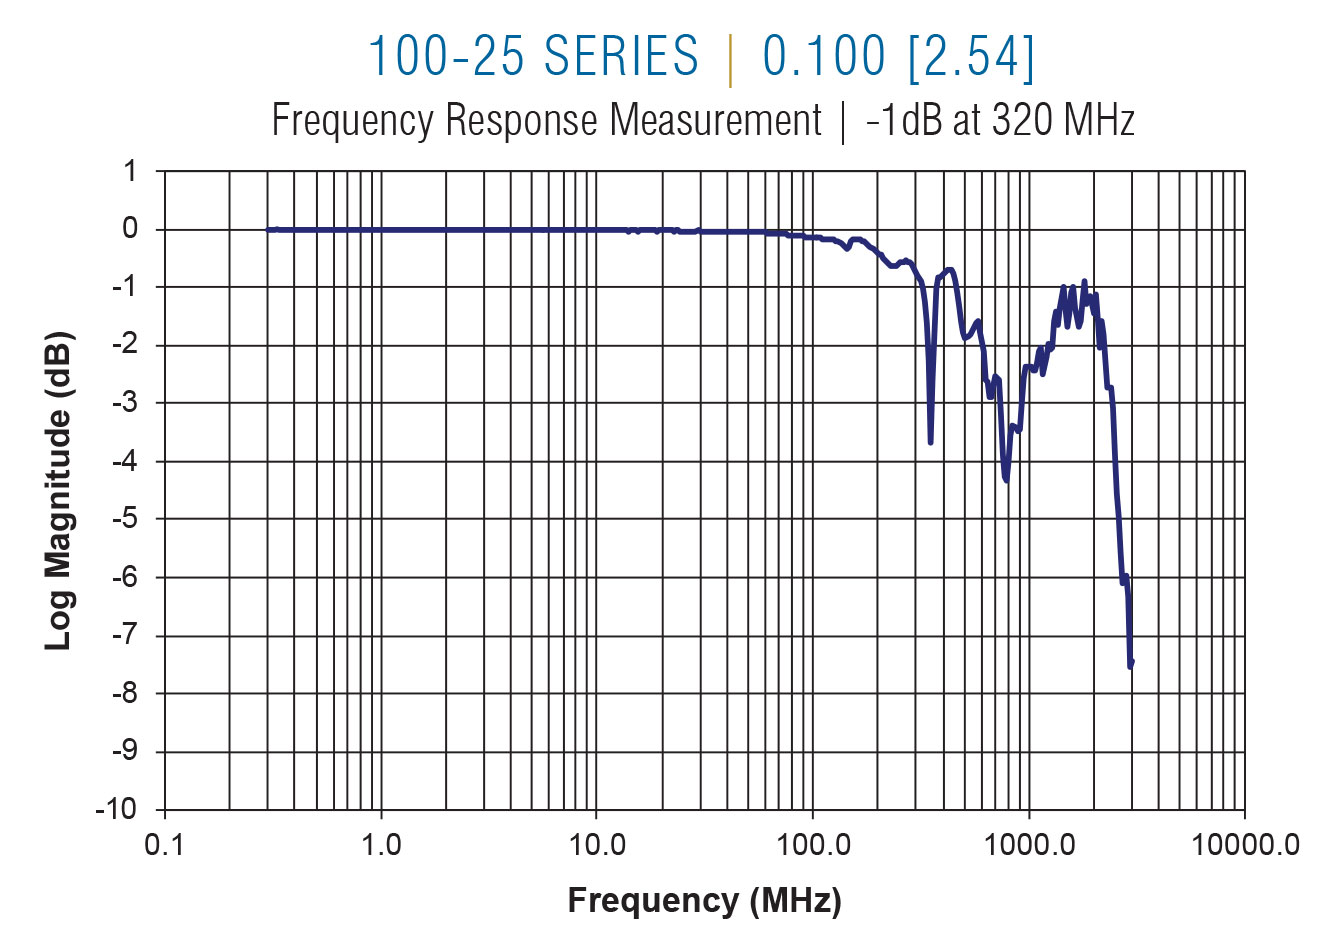
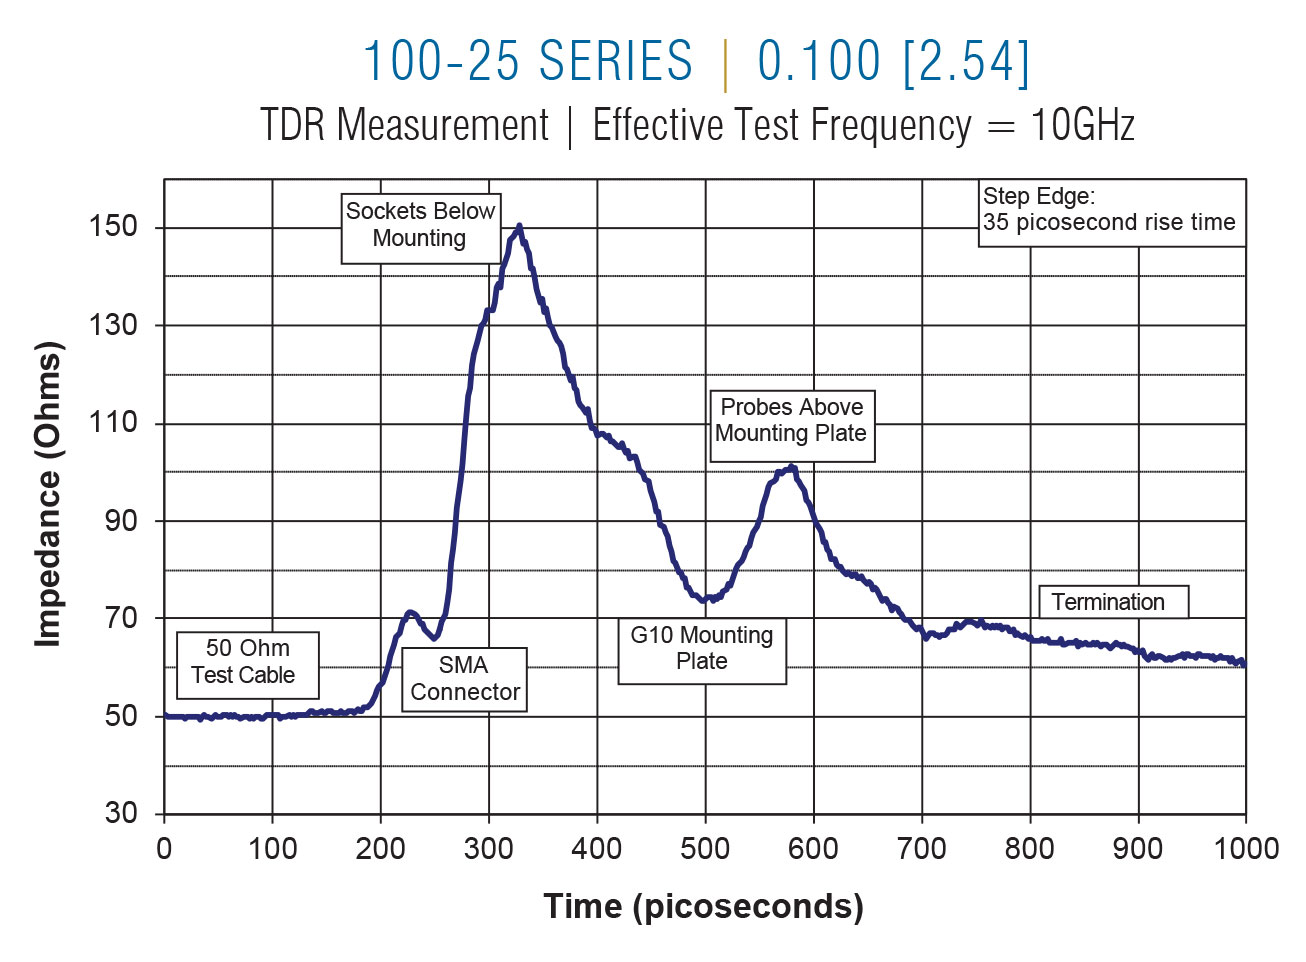
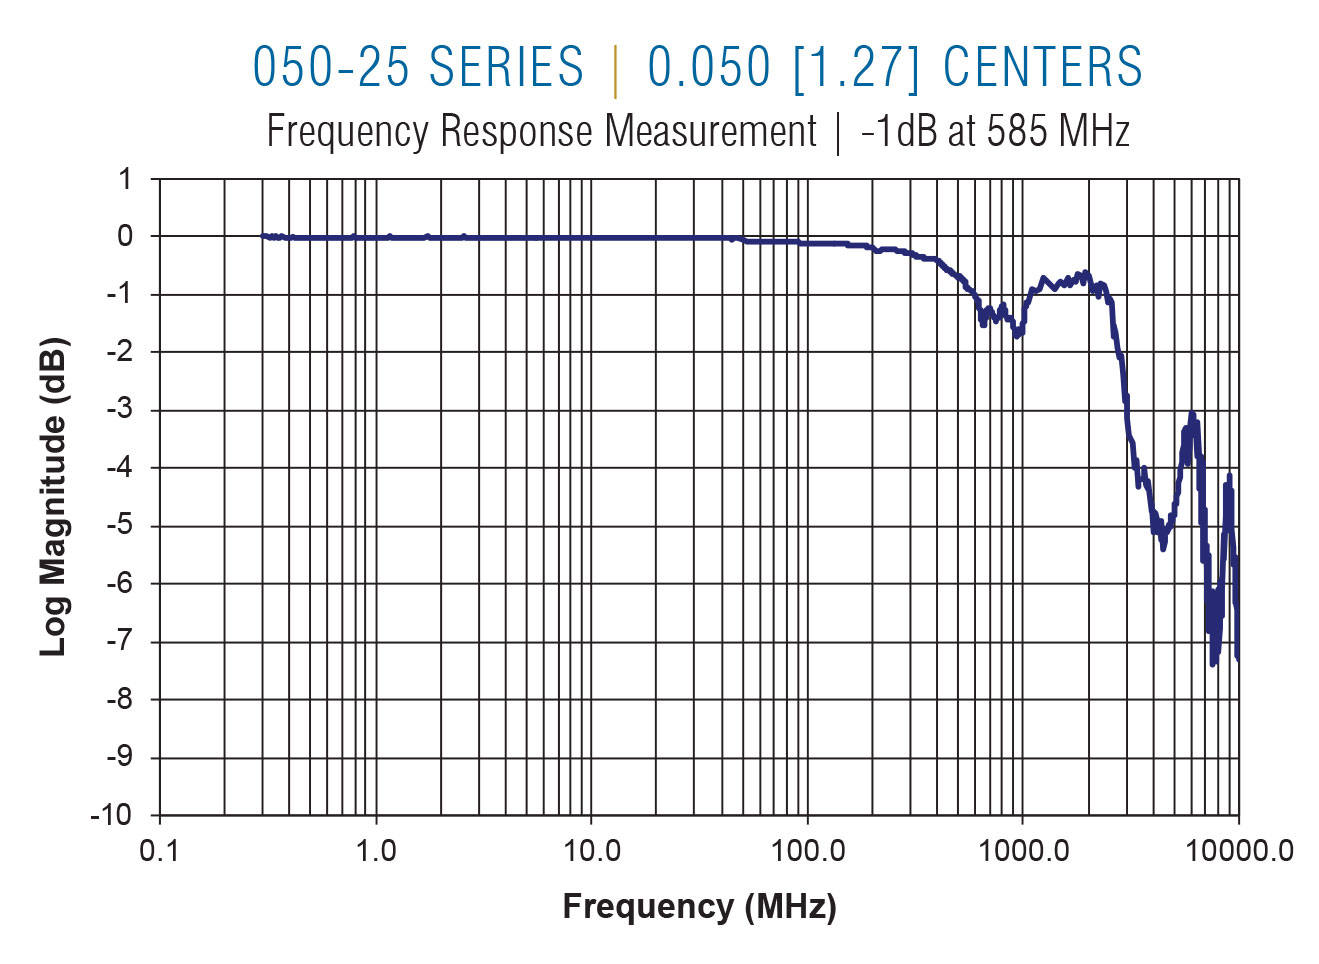
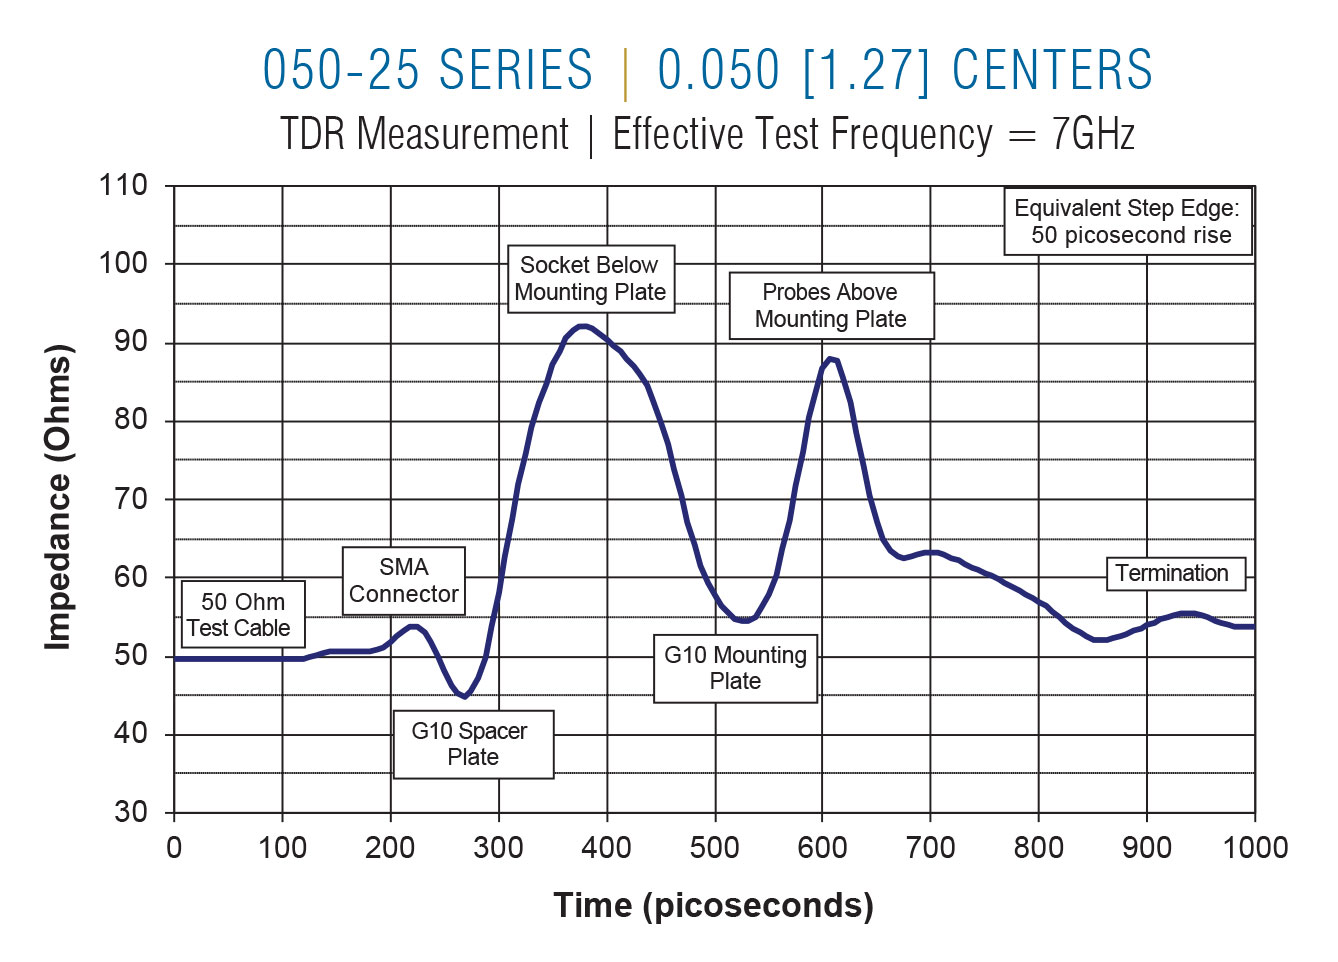
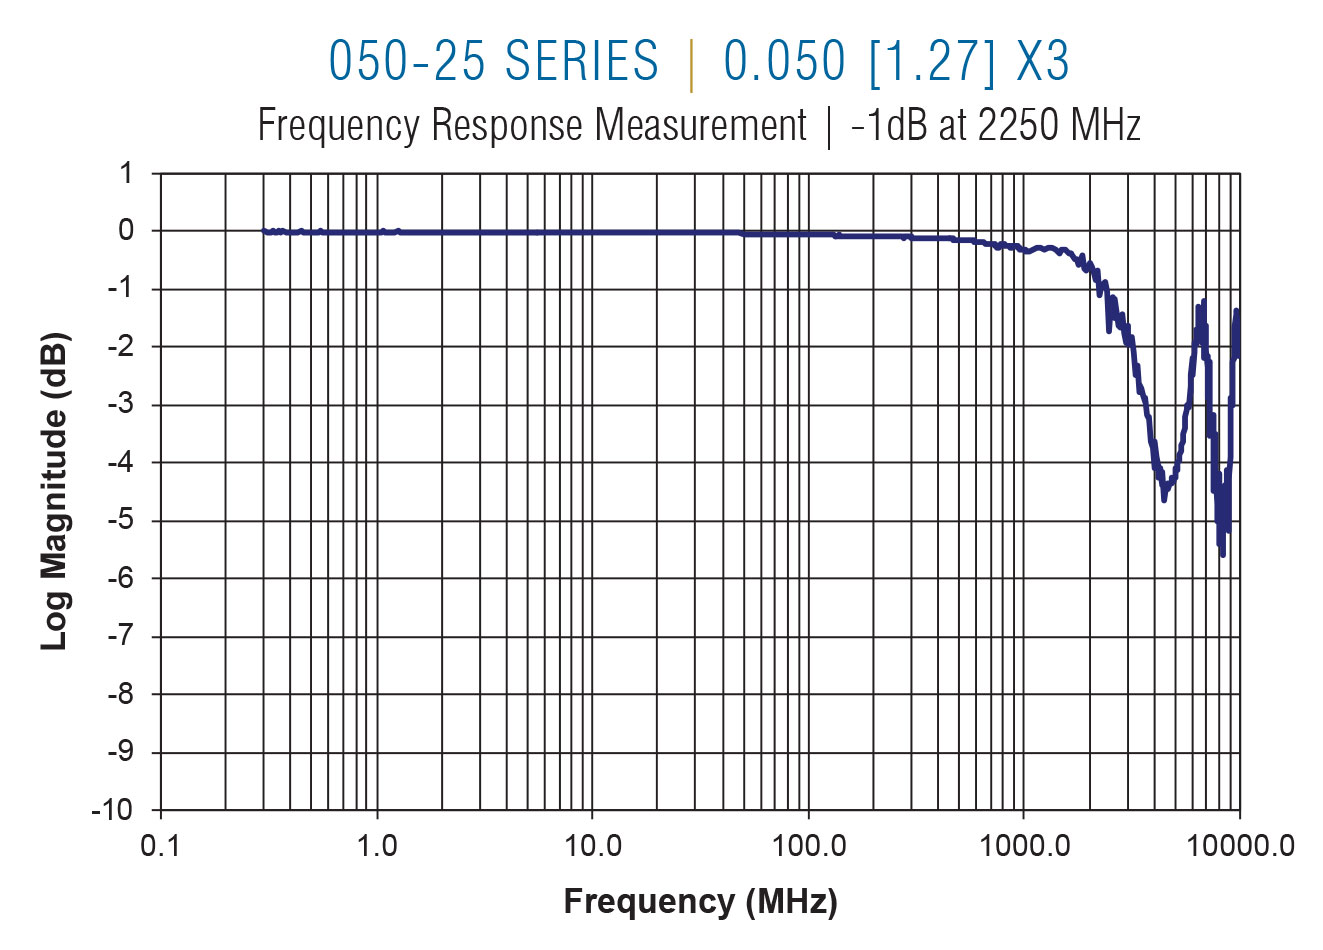
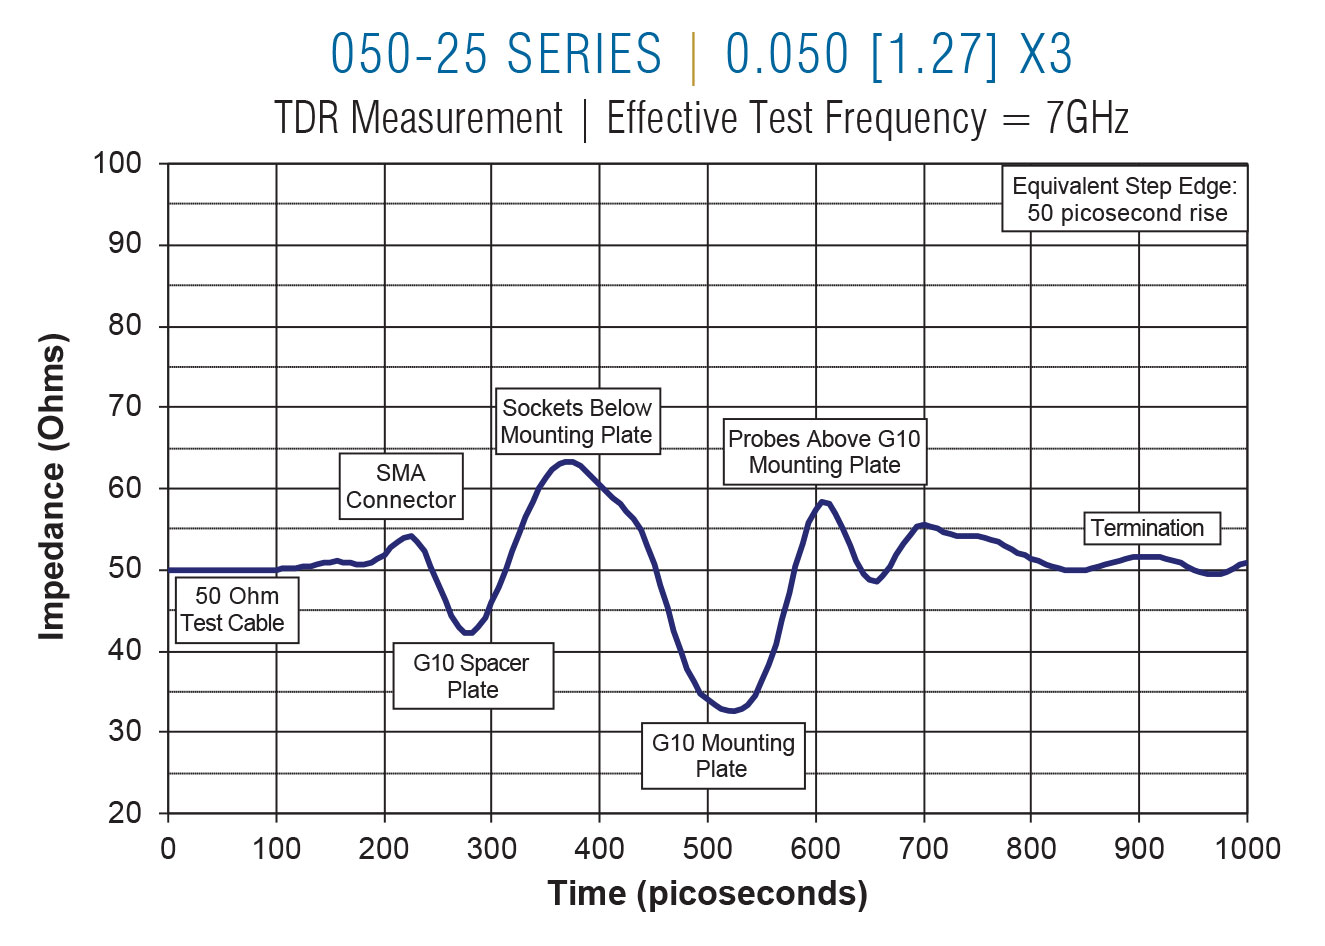
QA used a network analyzer to measure the frequency response characteristics of a wide variety of probe configurations. Initial testing of the wireless sockets utilized an RF network analyzer covering the frequency range of 300 KHz to 3 GHz. Subsequent testing using a microwave network analyzer covered the frequency range of 50 MHz to 20 GHz. For consistency, graphs of the more recent tests extrapolate data below 50 MHz and omit data above 10 GHz. QA used a TDR oscilloscope to look at the impedance of the signal path through the test fixture and obtained time domain impedance information by use of the time domain transform option of the microwave network analyzer.
Test fixtures were constructed for 100, 75, 50, and 39mil wireless socket products. These fixtures comprised a 0.250 [6.35] G10 socket mounting plate, a 0.062 [1.57] G10 socket spacer plate, and two electrical interface boards attached to the socket mounting plate with non-conducting standoffs. Test fixtures for the X75, X50, X39, and X31wireless termination pins were built up from multiple G10 plates totaling 1.562 [39.67] and sandwiched between two electrical interface boards. In all the fixtures, the electrical interface boards provided the SMA connectors for the test equipment and copper traces to contact the various probe/socket configurations. Configurations comprised different center spacing for the ground and signal probes, multiple ground probes, and arrangements to measure cross-talk where one pair of probes was “driven” and the “pick up” on an adjacent pair measured.
The following graphs study the performance of the X75 probes. Comparable data for all other wireless assemblies follow.
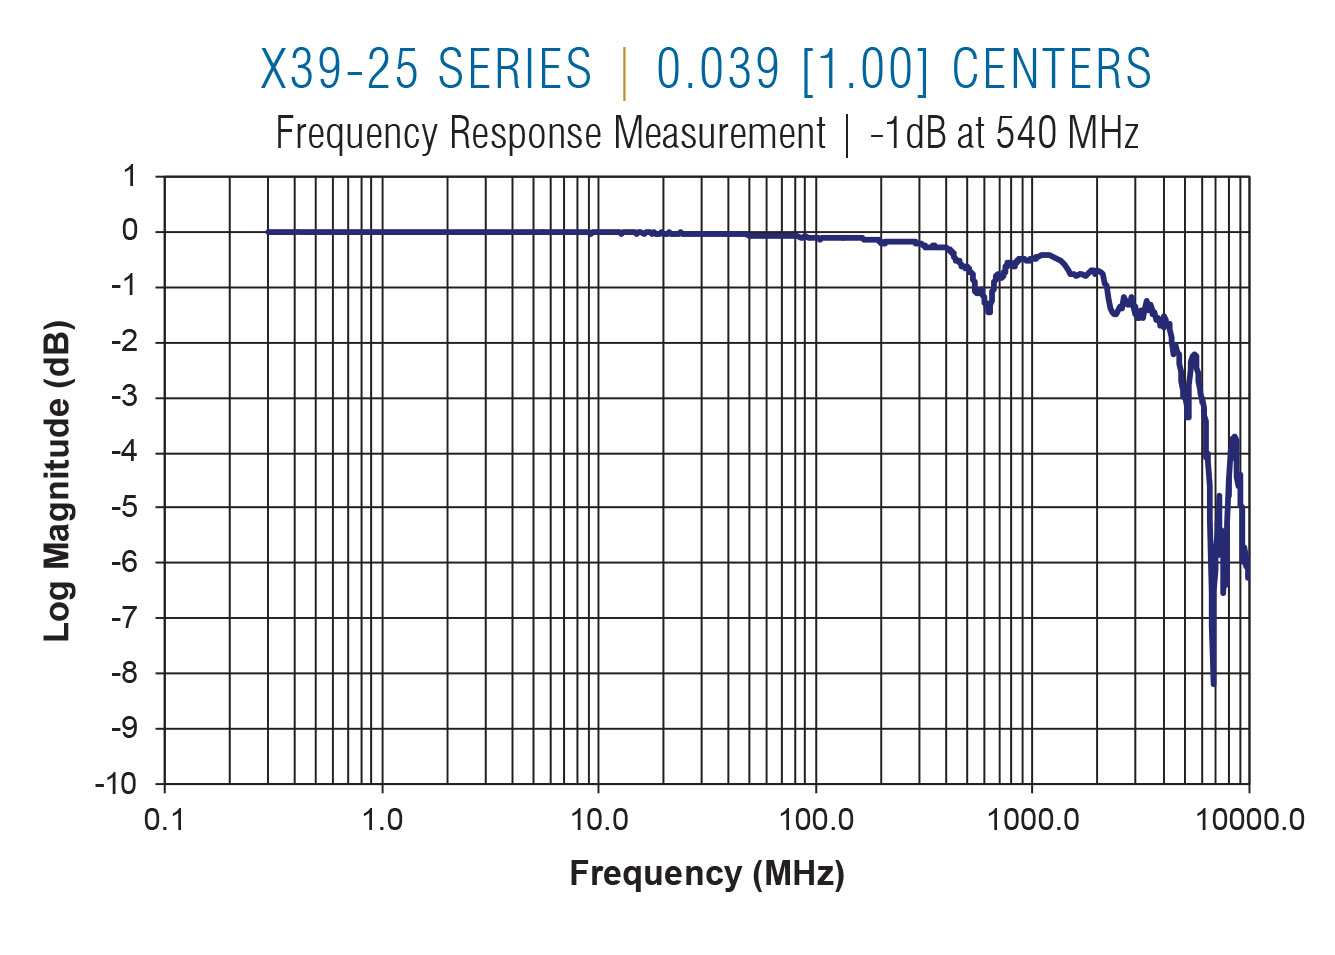
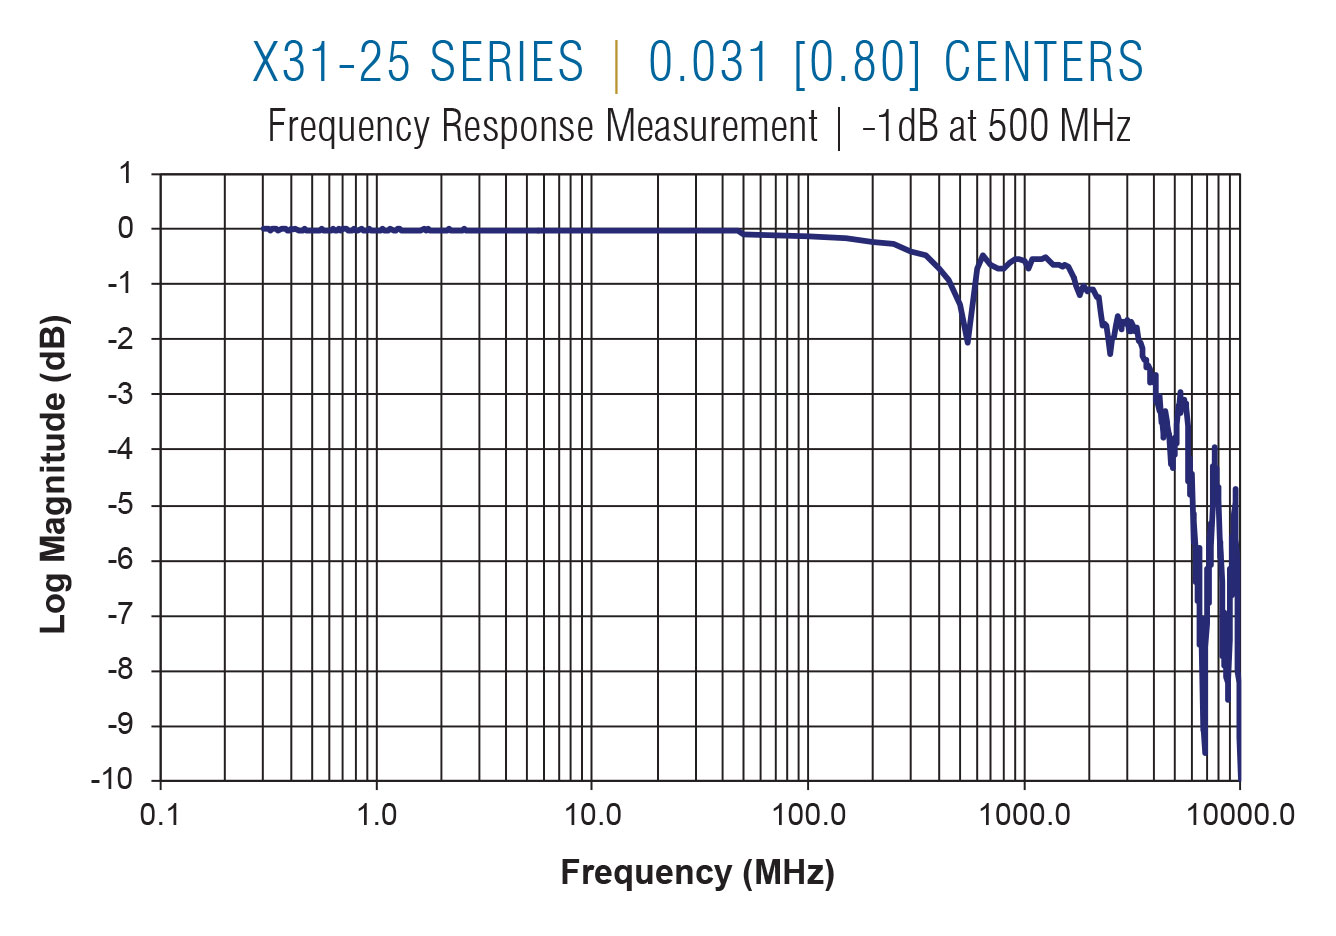
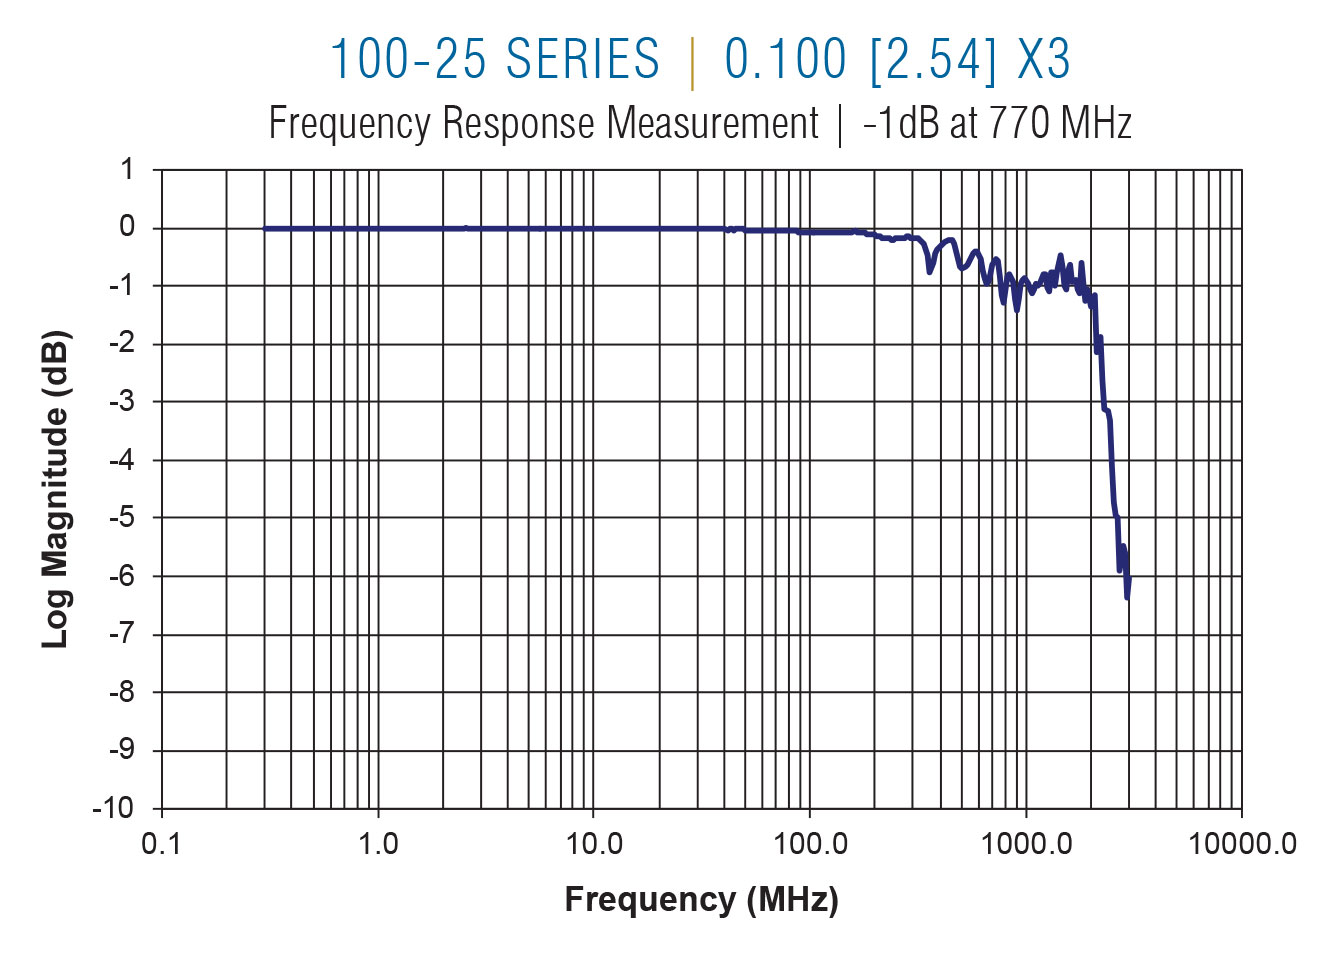
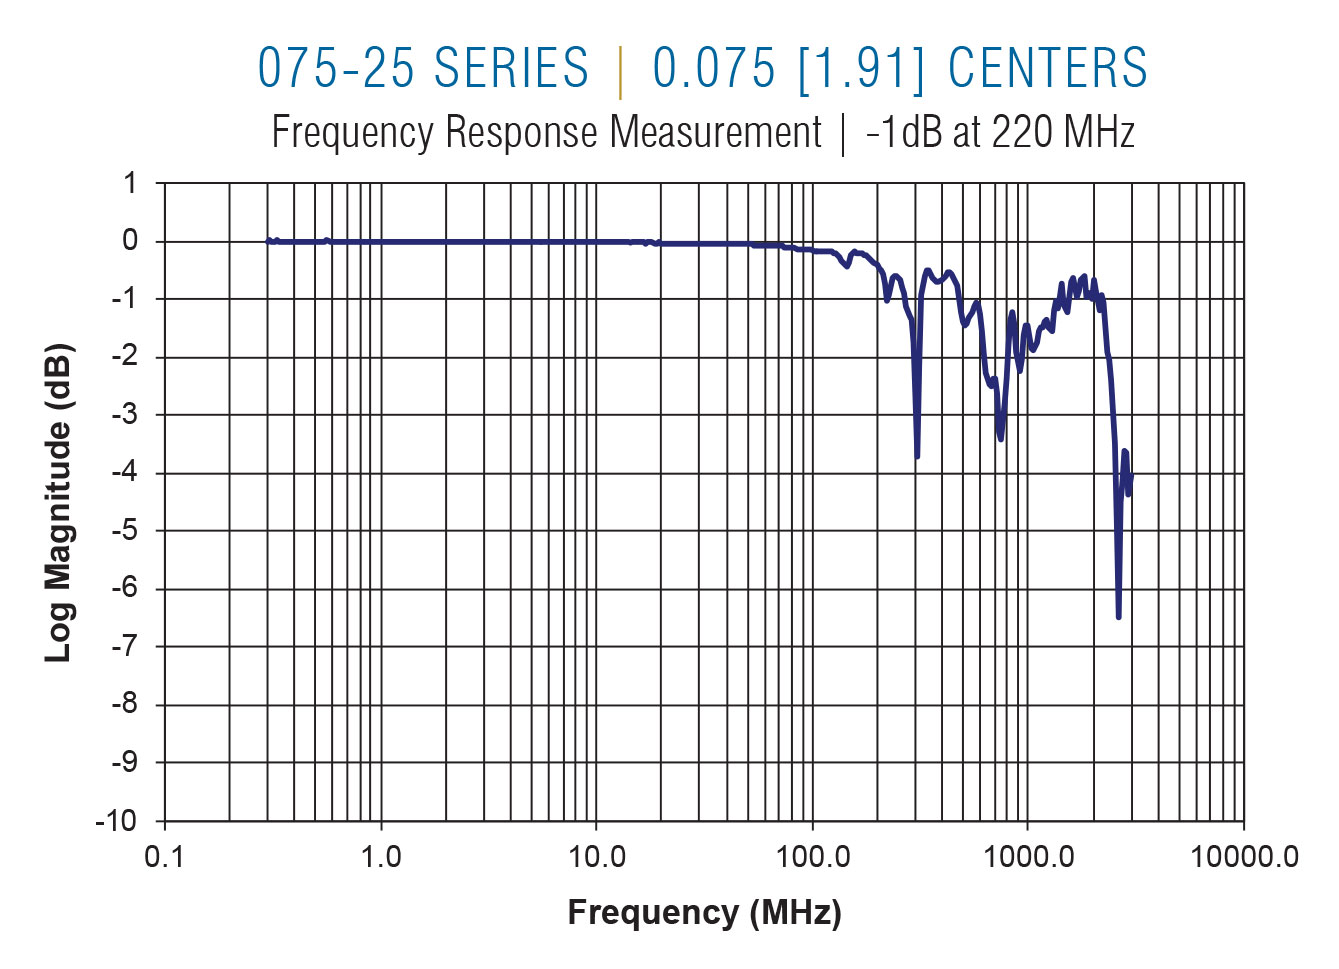
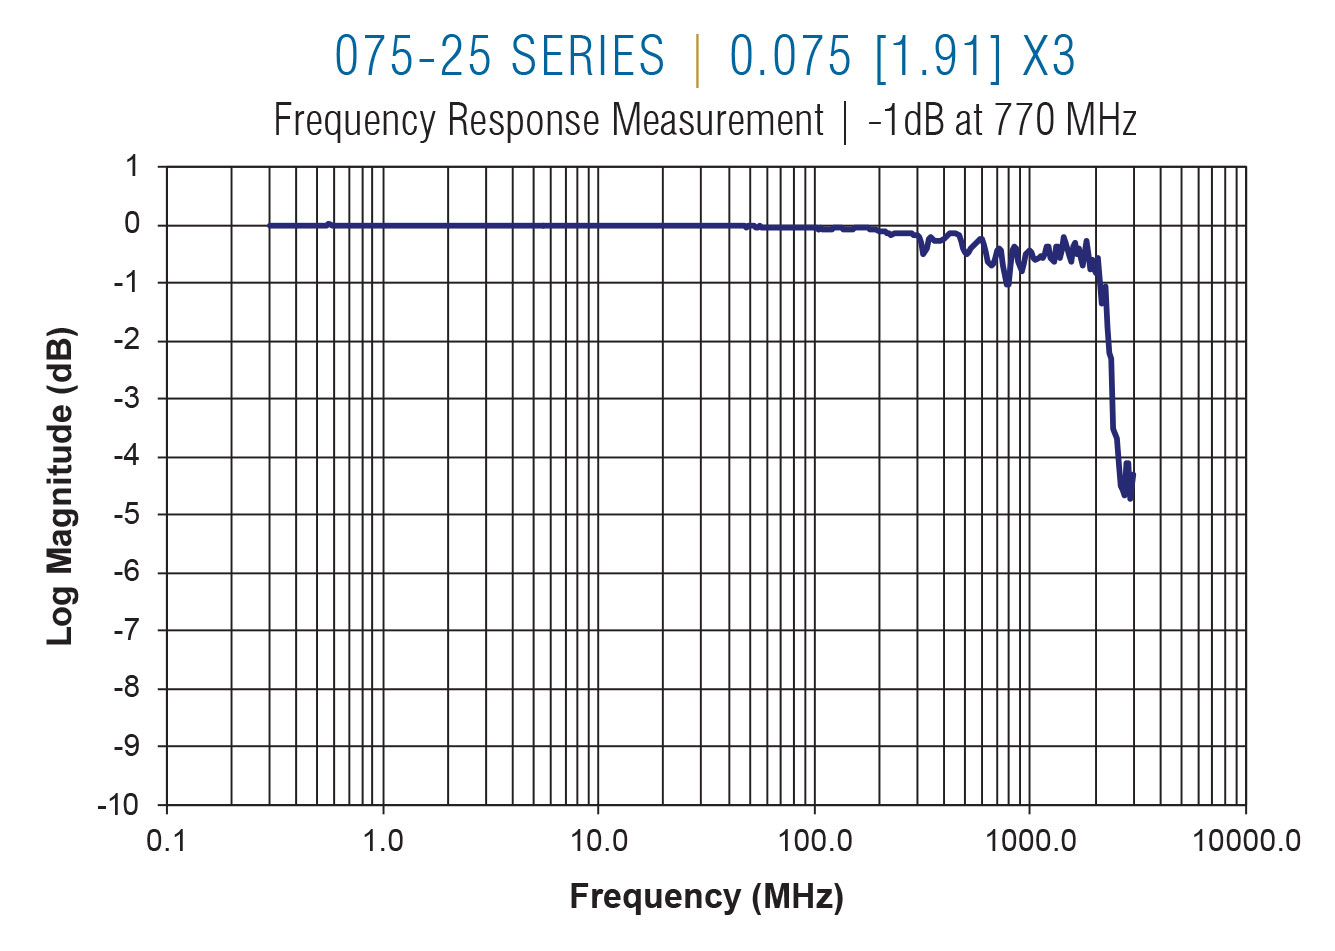
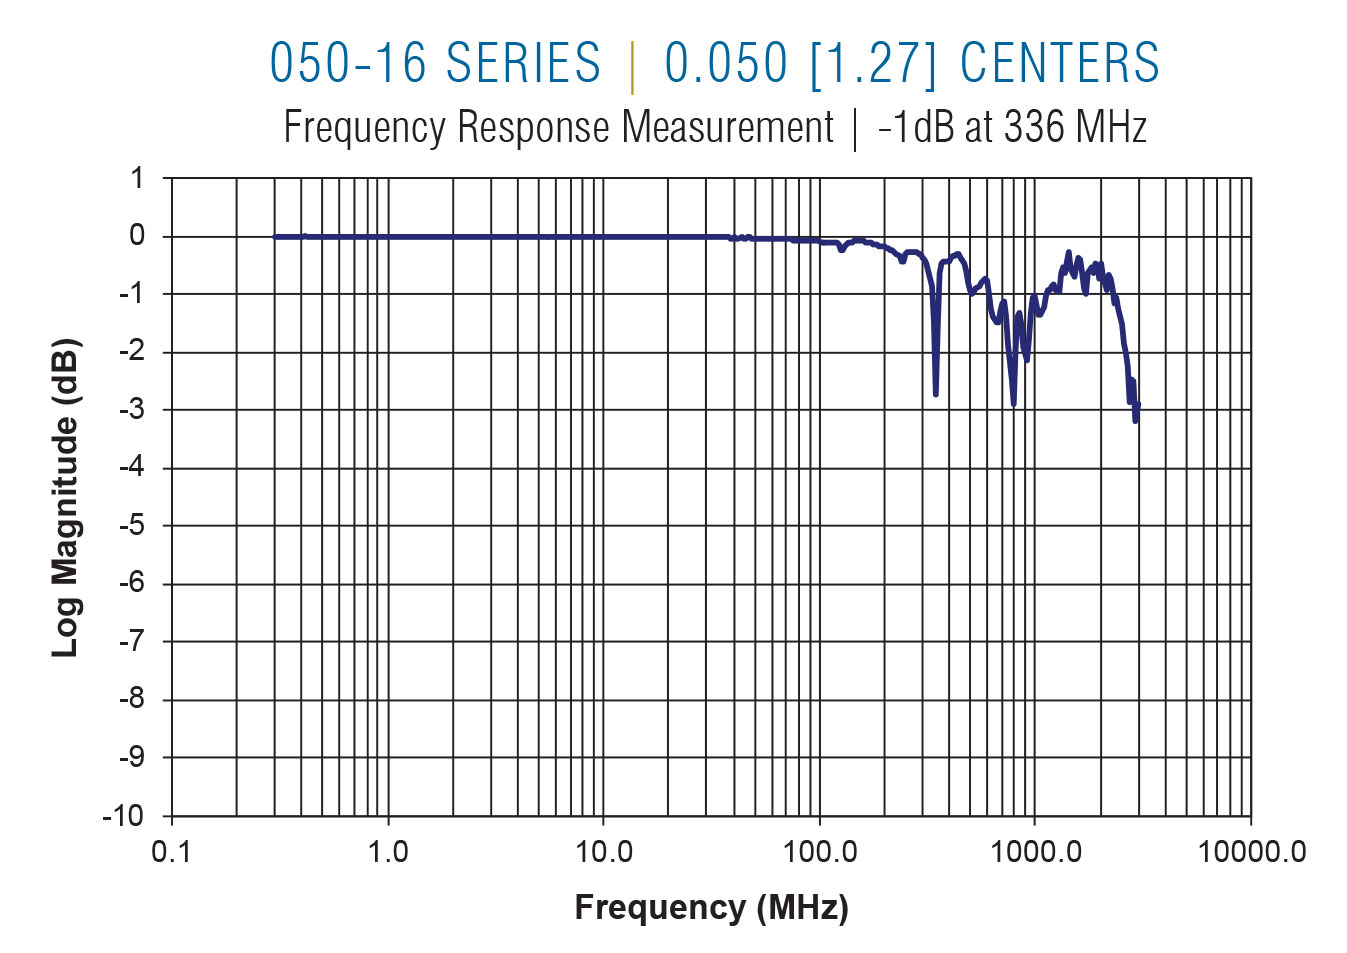
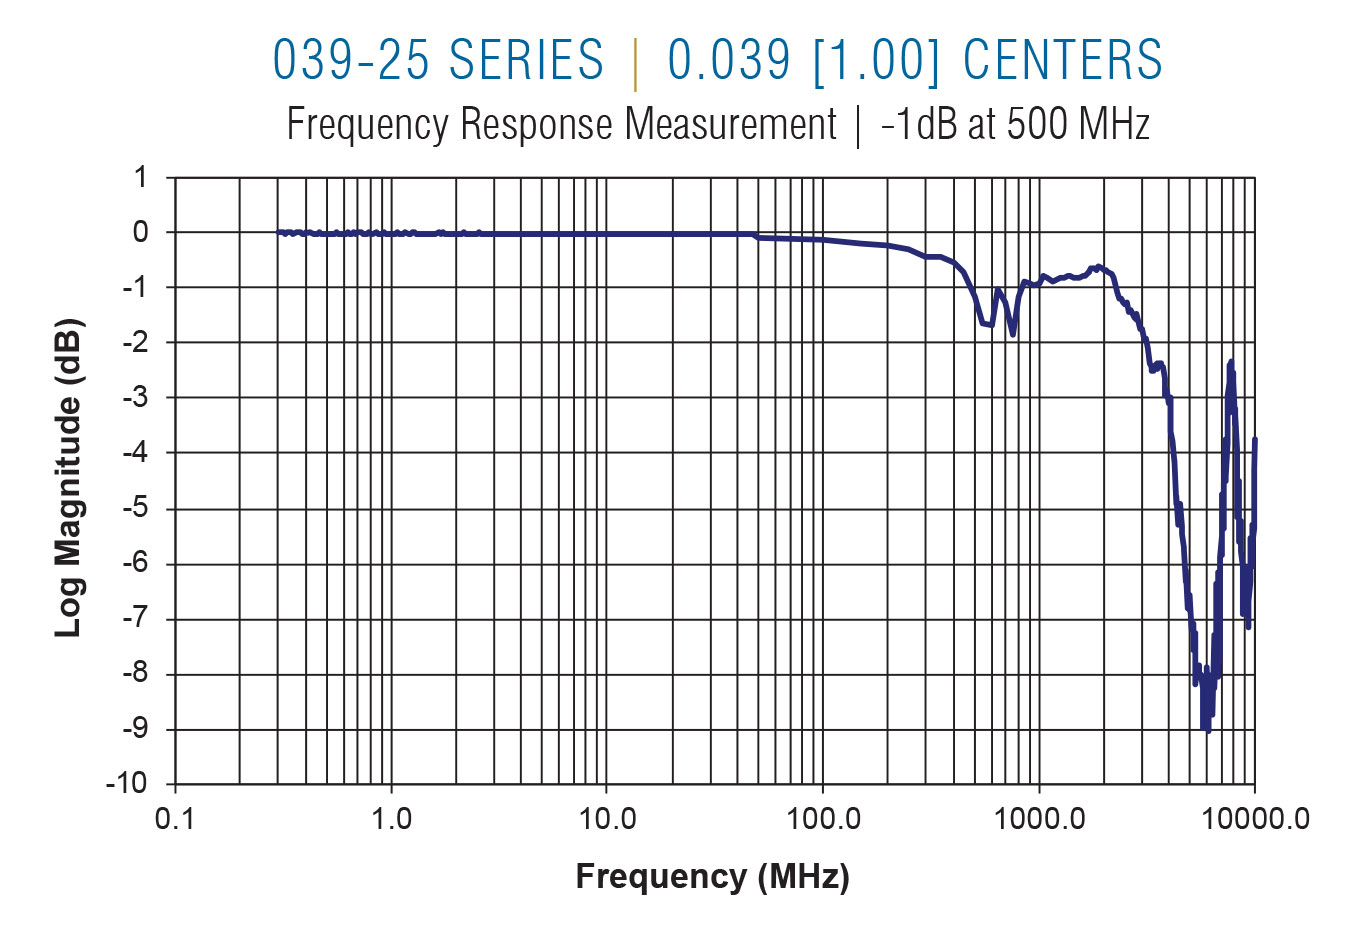
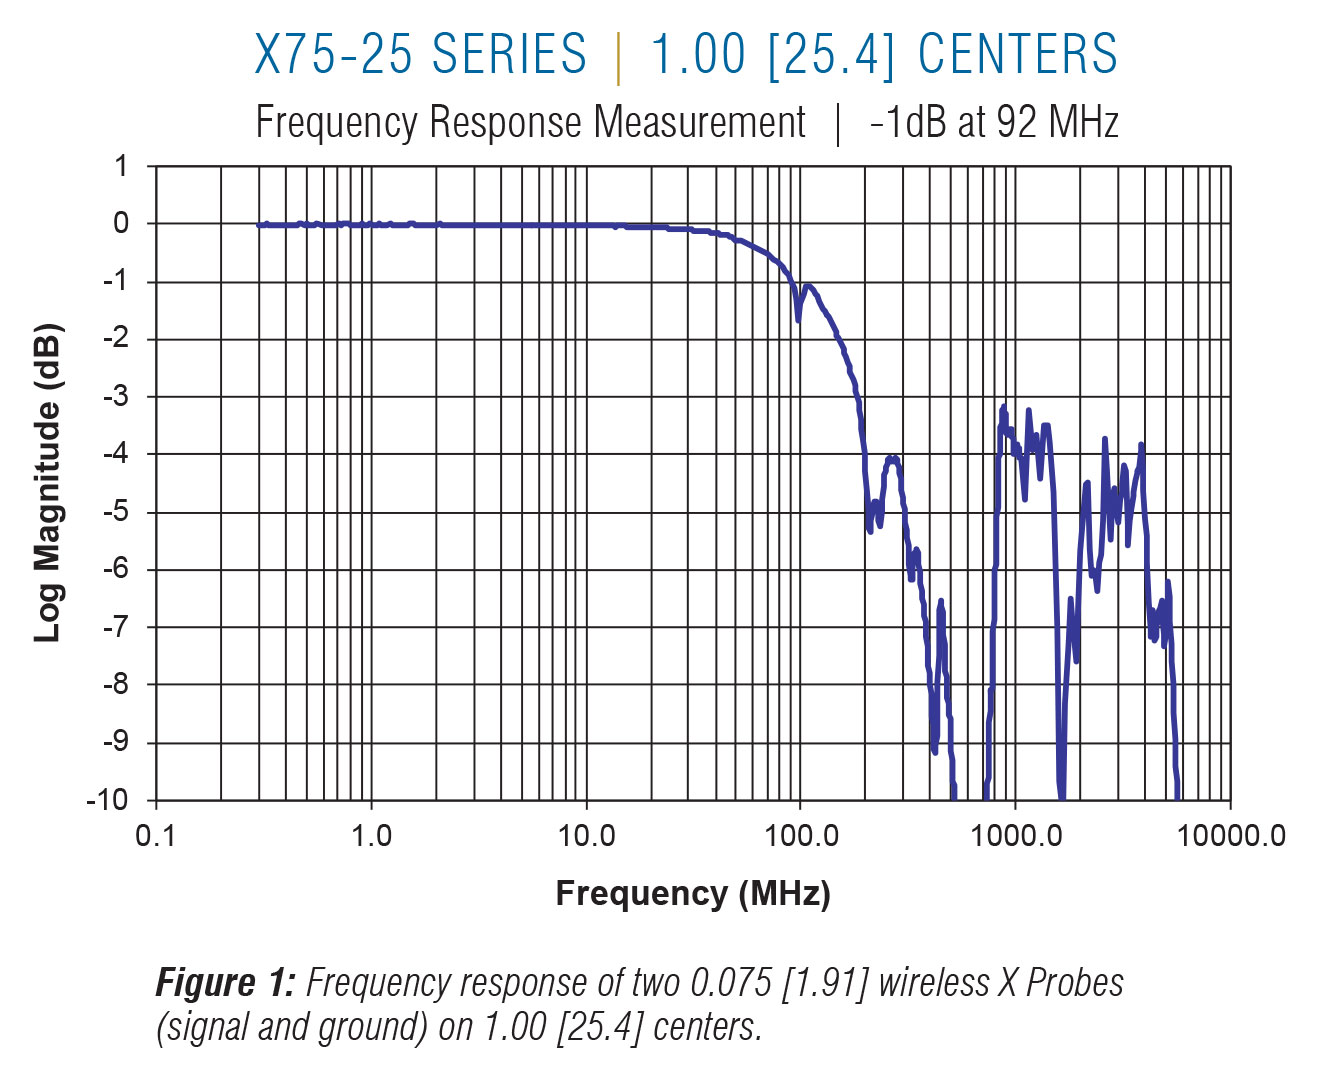
Figure 1 shows the frequency response of two X75 probes on 1.00 [25.4] centers. This might be representative of the signal probe to ground probe separation for an IC package. Note the bandwidth roll-off below 100 MHz. This response is dominated by the separation between the signal and ground probe. Plots for the other wireless probe families tested on 1.00 [25.4] centers have very similar performance. In Figure 2, the probes are on their nominal 0.075 [1.91] centers. On these closer centers, a –1dB frequency response to over 400 MHz is achieved. This improvement is the result of the more closely-spaced probes providing a better match to the impedance of the 50 Ohm test environment.
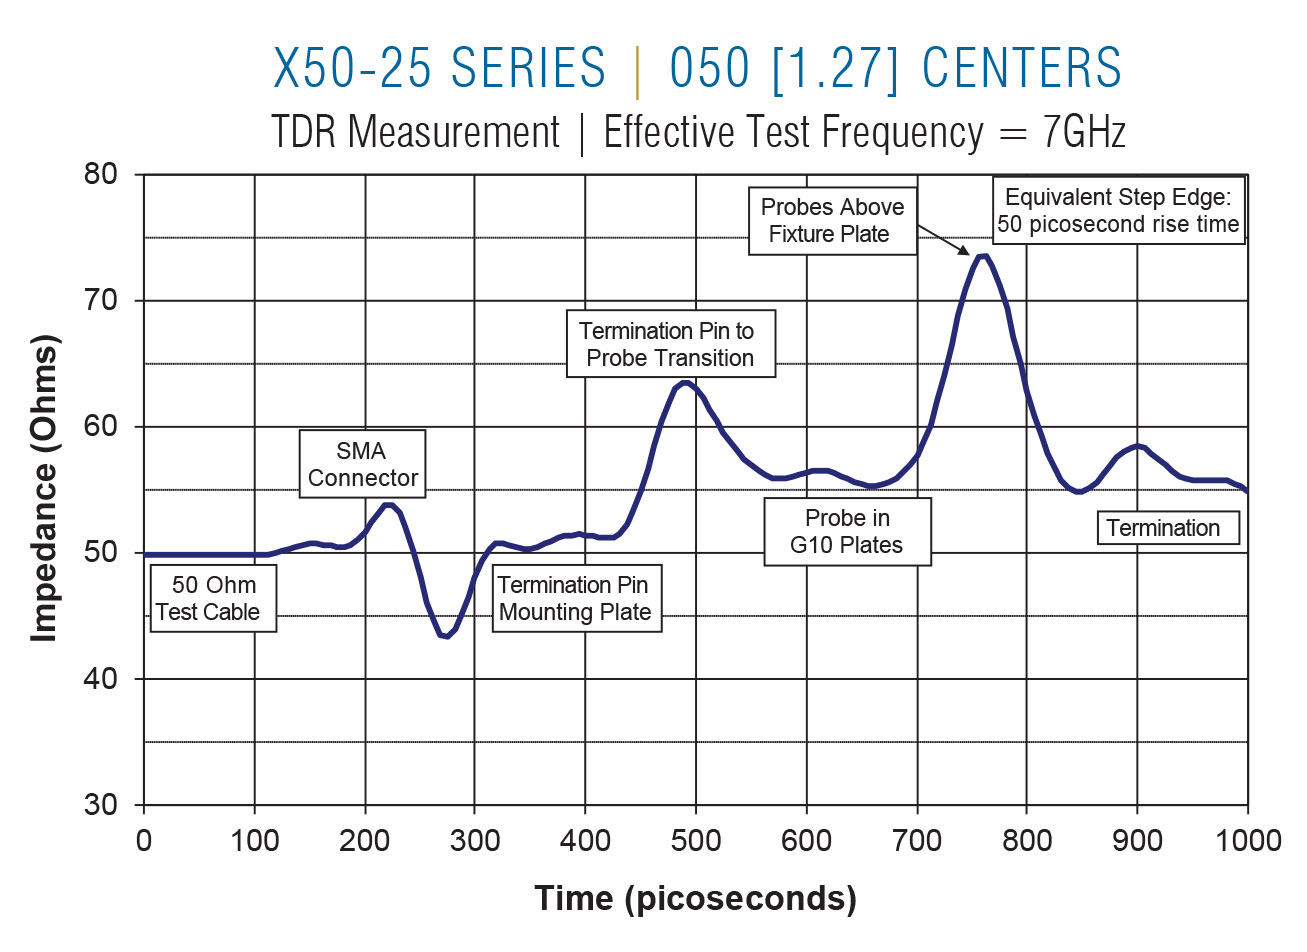
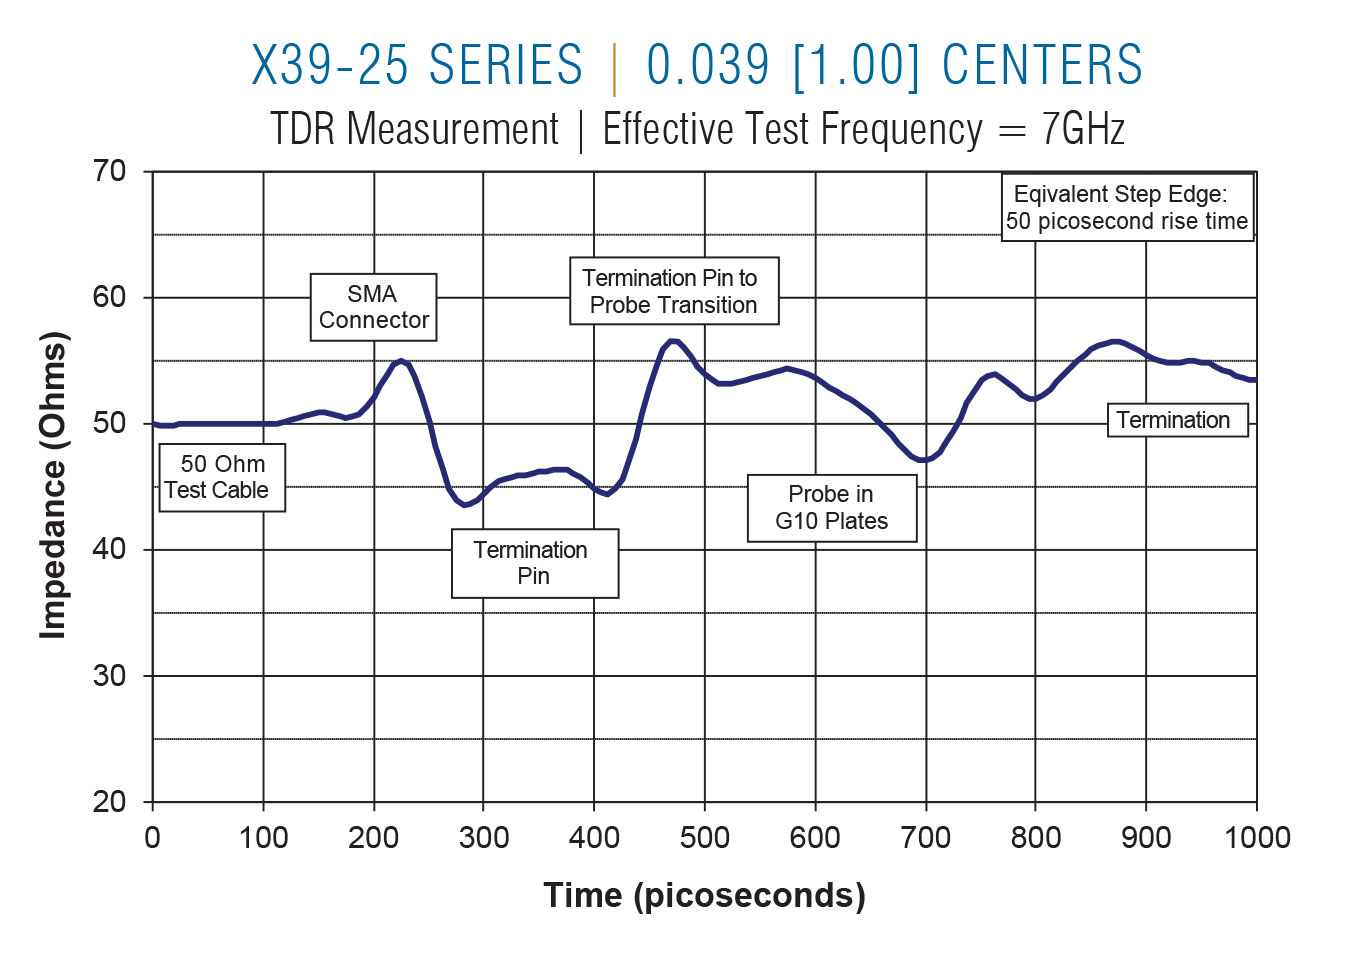
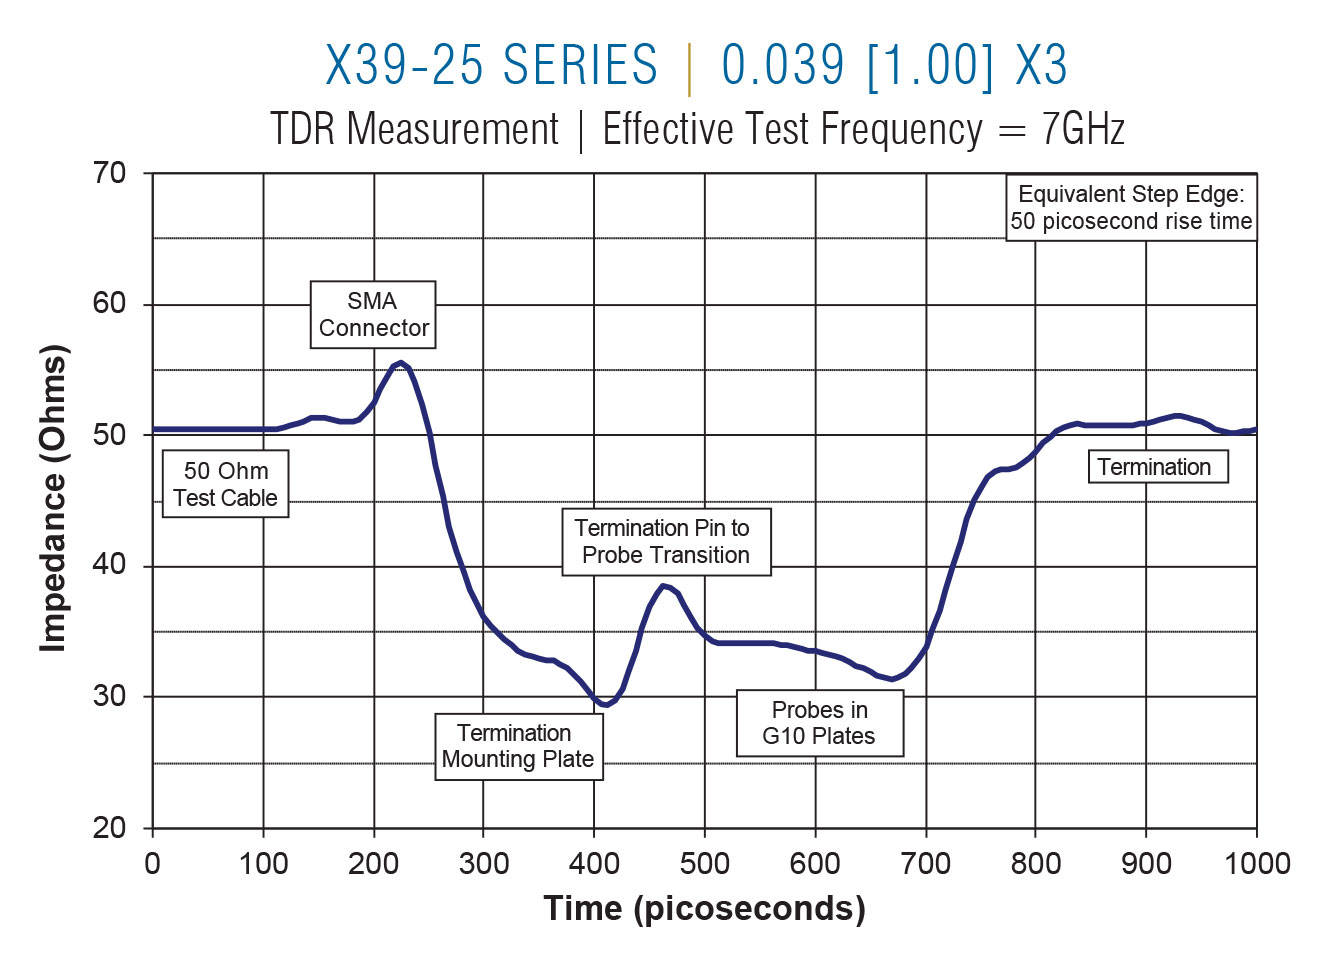
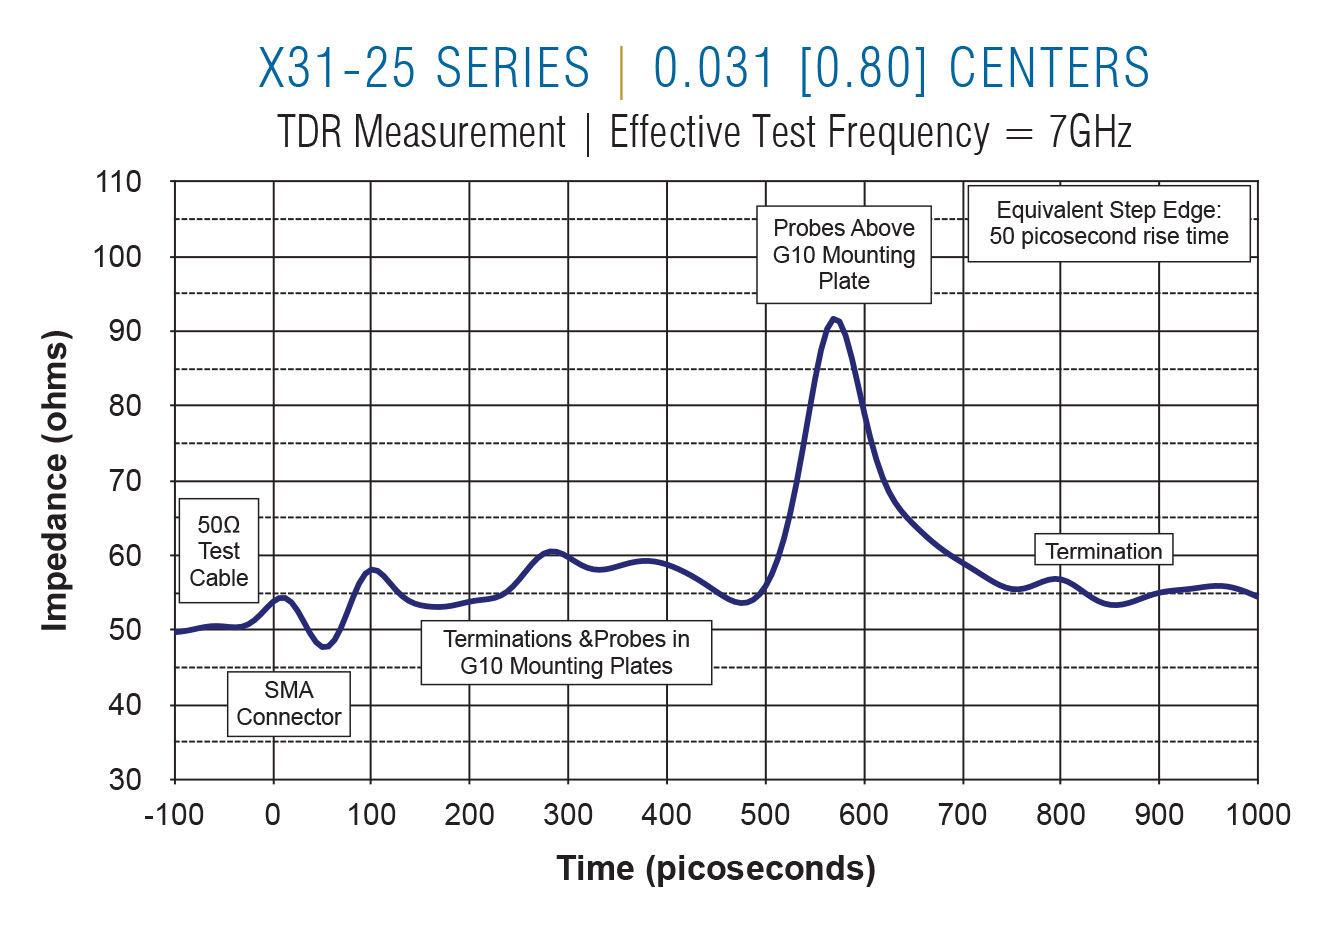
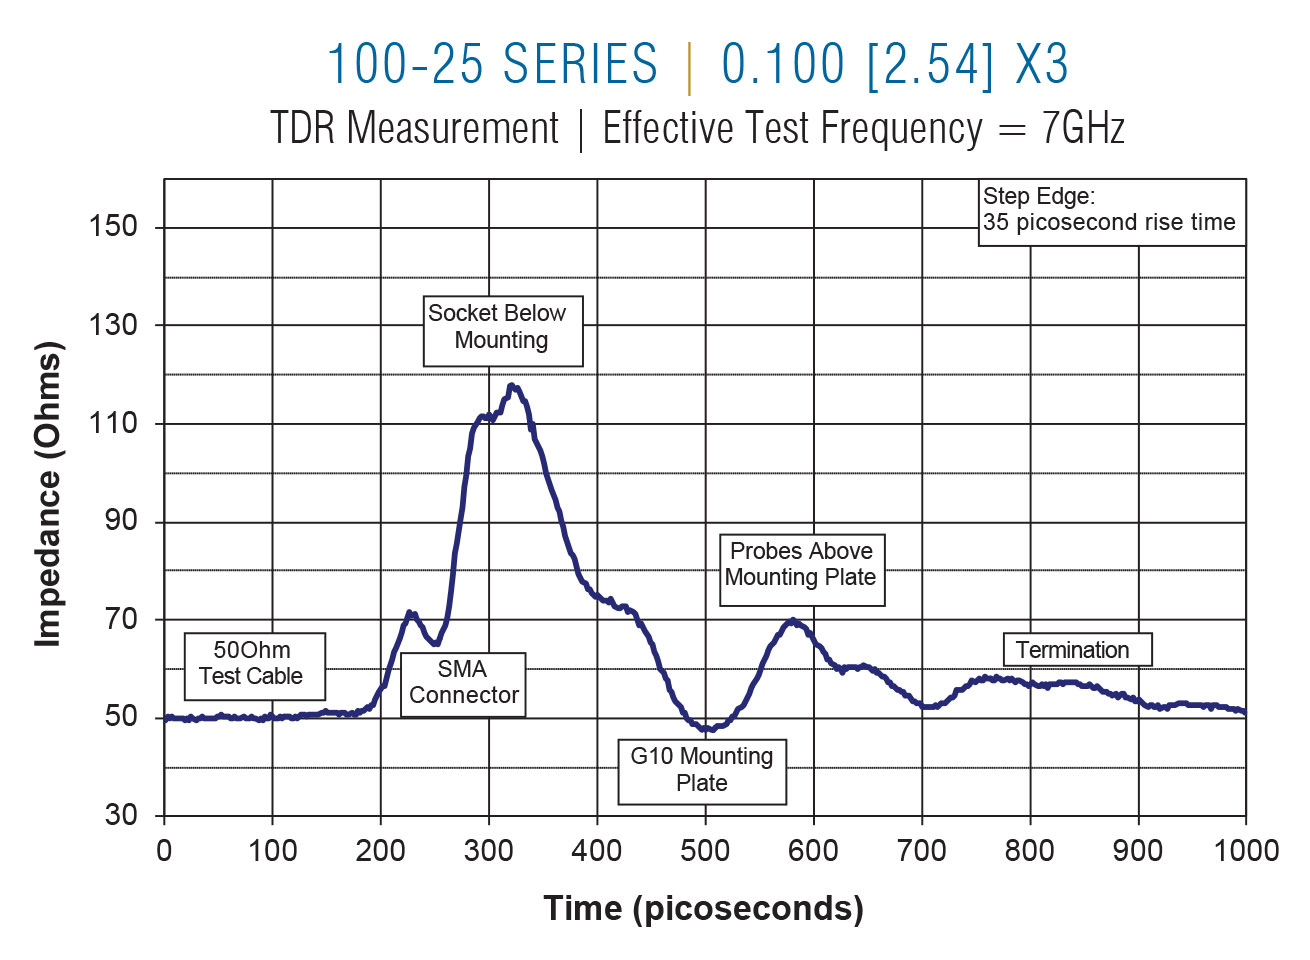
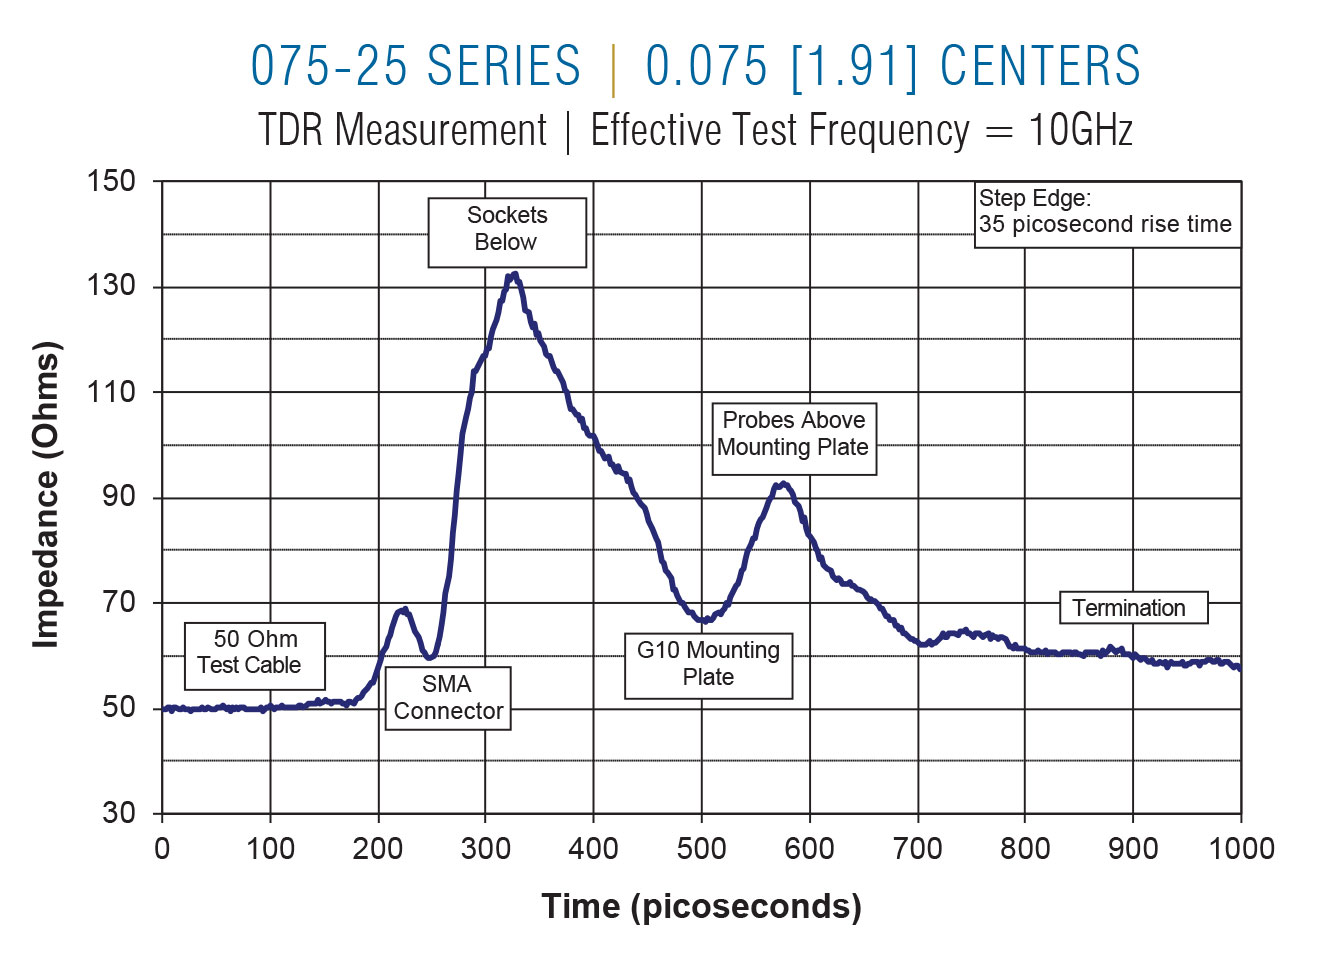
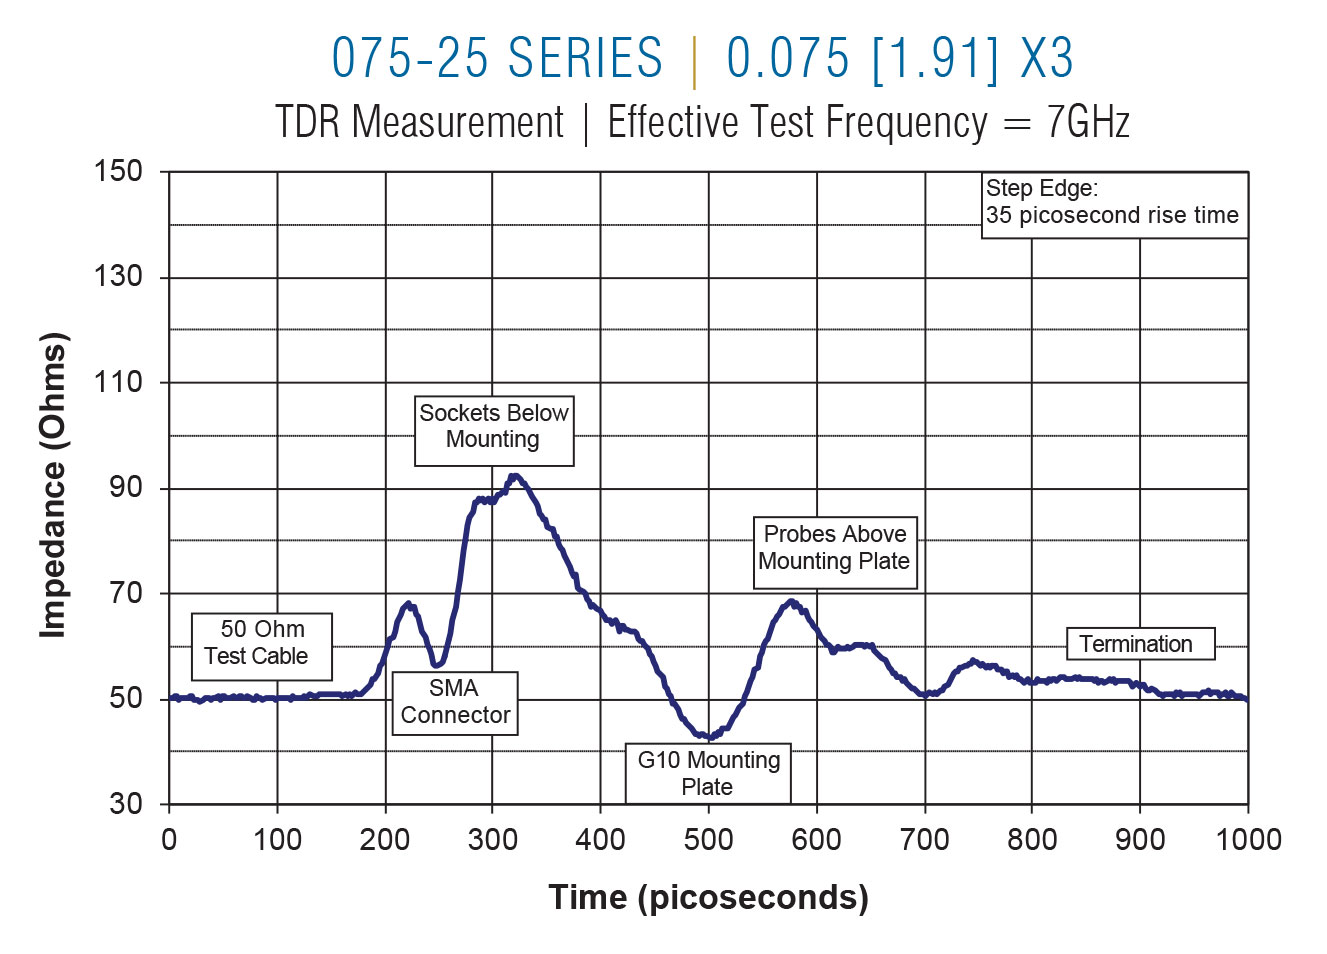
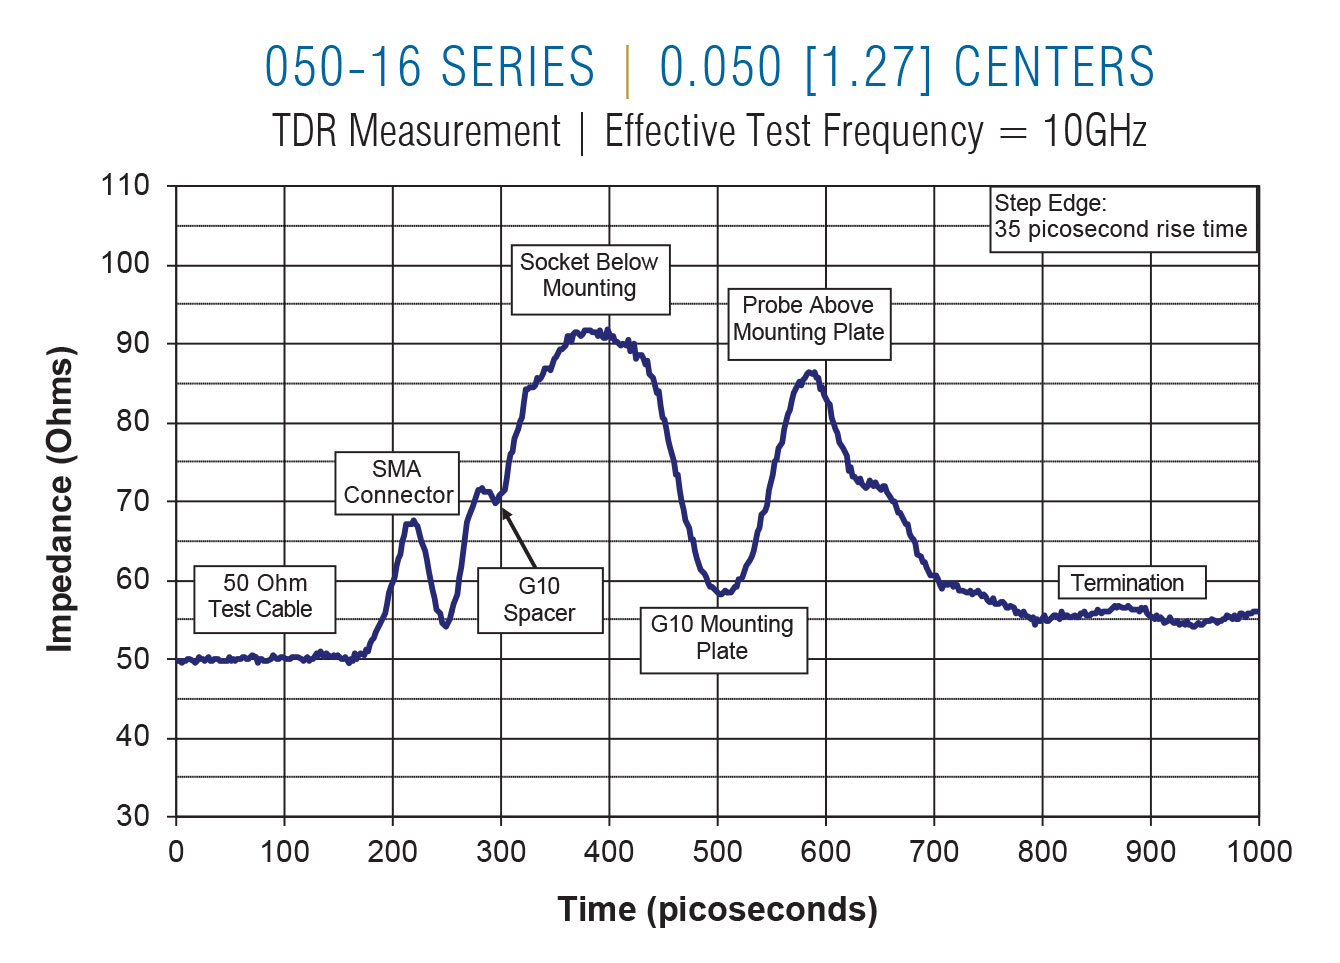
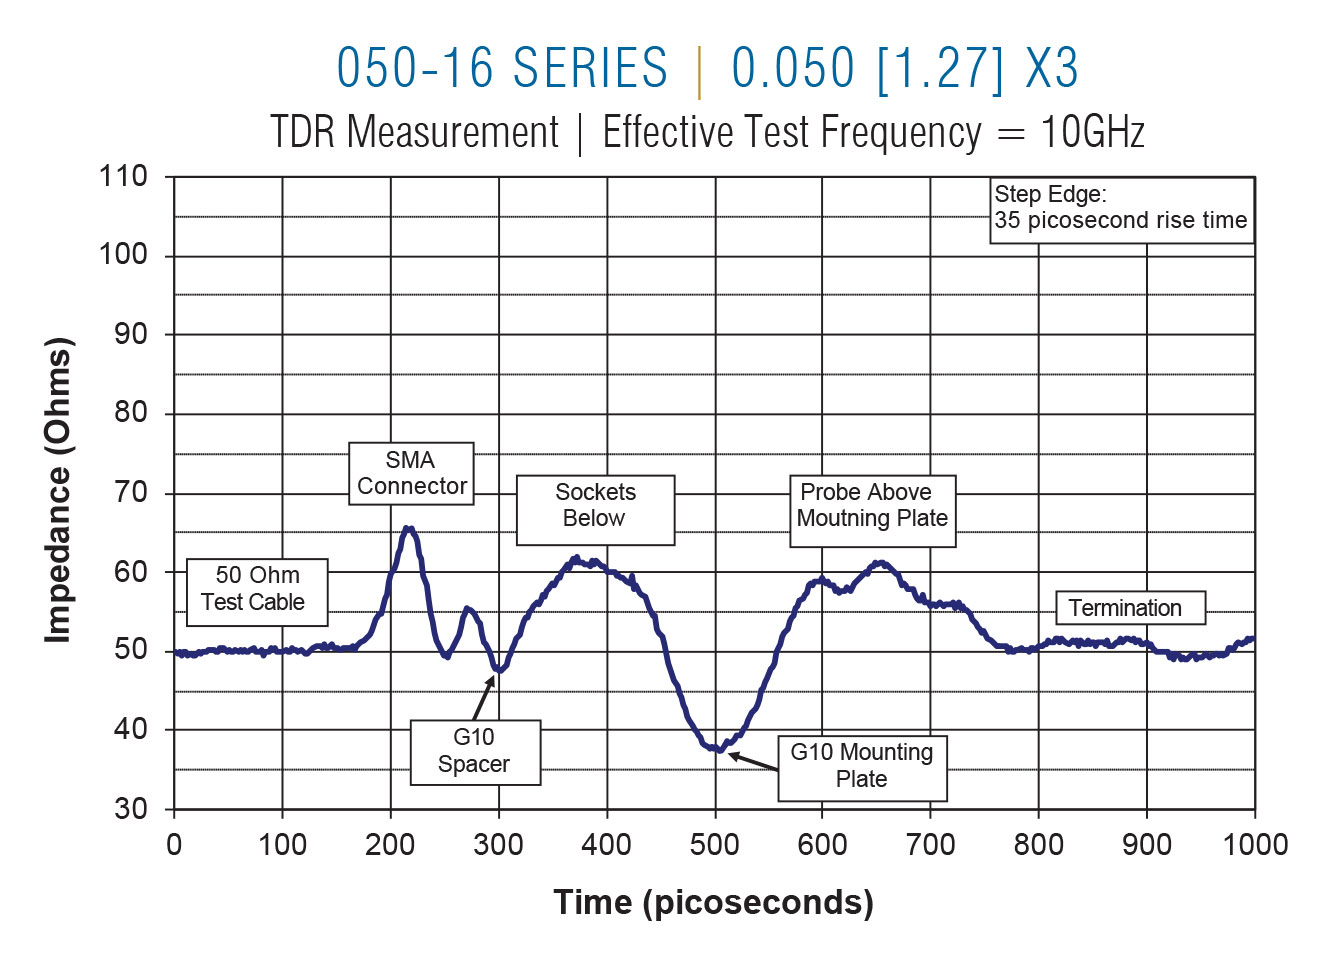
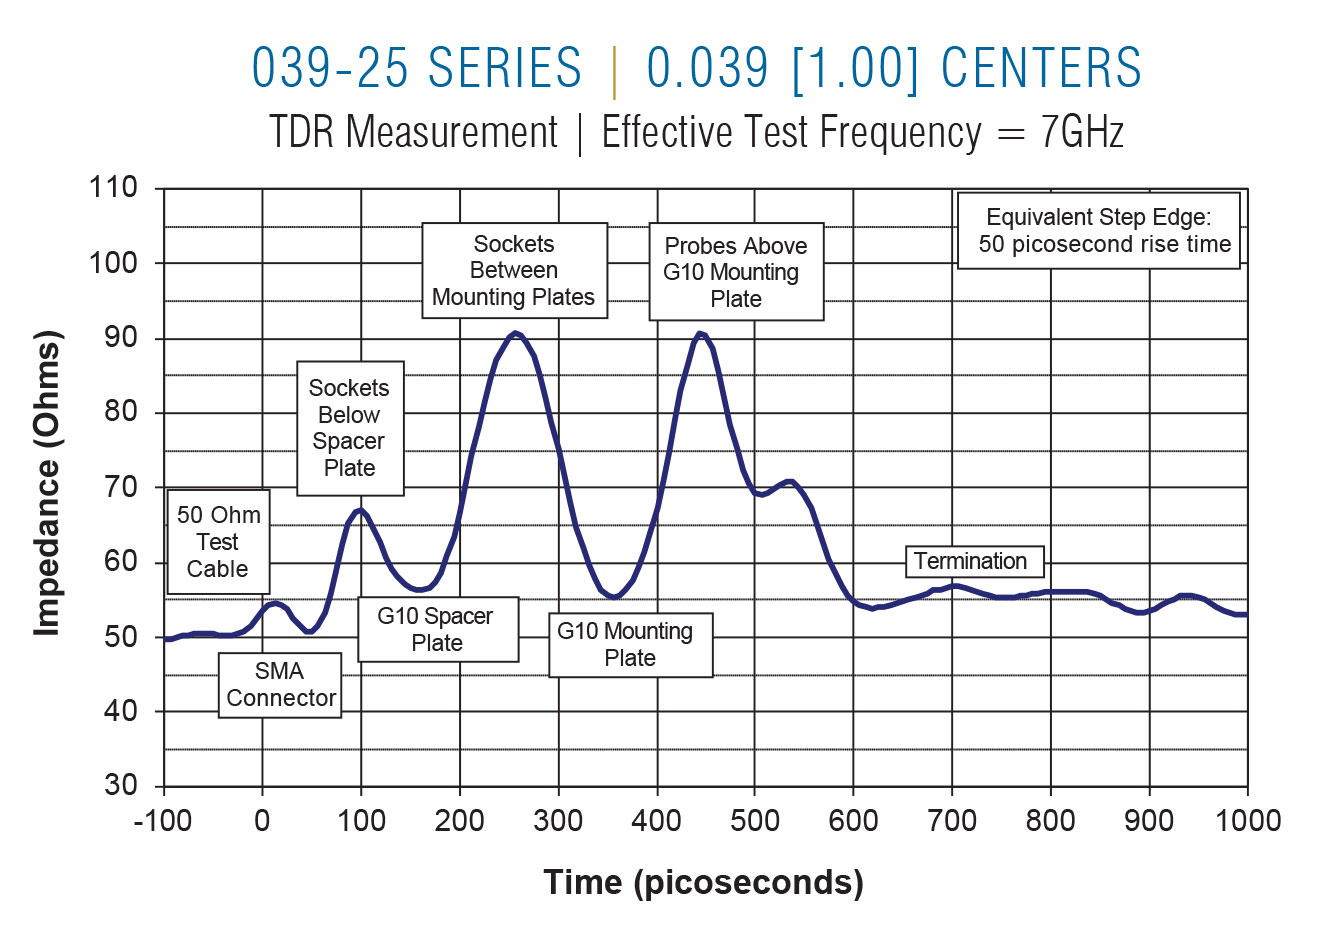
The TDR option of the microwave network analyzer allows measurement of the impedance of a transmission line at any point along its length. Figure 3 shows the impedance of two wireless 0.075 [1.91] QA X Probes® on 0.075 [1.91] centers. In this TDR graph, the transmitted signal has an effective rise time of 50 picoseconds, which equates to a 7 GHz test frequency. The impedance extremes are exaggerated by the high bandwidth of the measurement; at lower frequencies the impedance differences would be less apparent. These high frequency measurements show three distinct physical regions: the termination pin, the transition from the termination pin to the X Probe, and the X Probe itself. These changes of impedance are caused by the differing diameters of the termination pins and probes as well as the drilled clearances surrounding them. The nature of the dielectric material separating the probes also plays a critical role in determining the characteristic impedance of the transmission line.
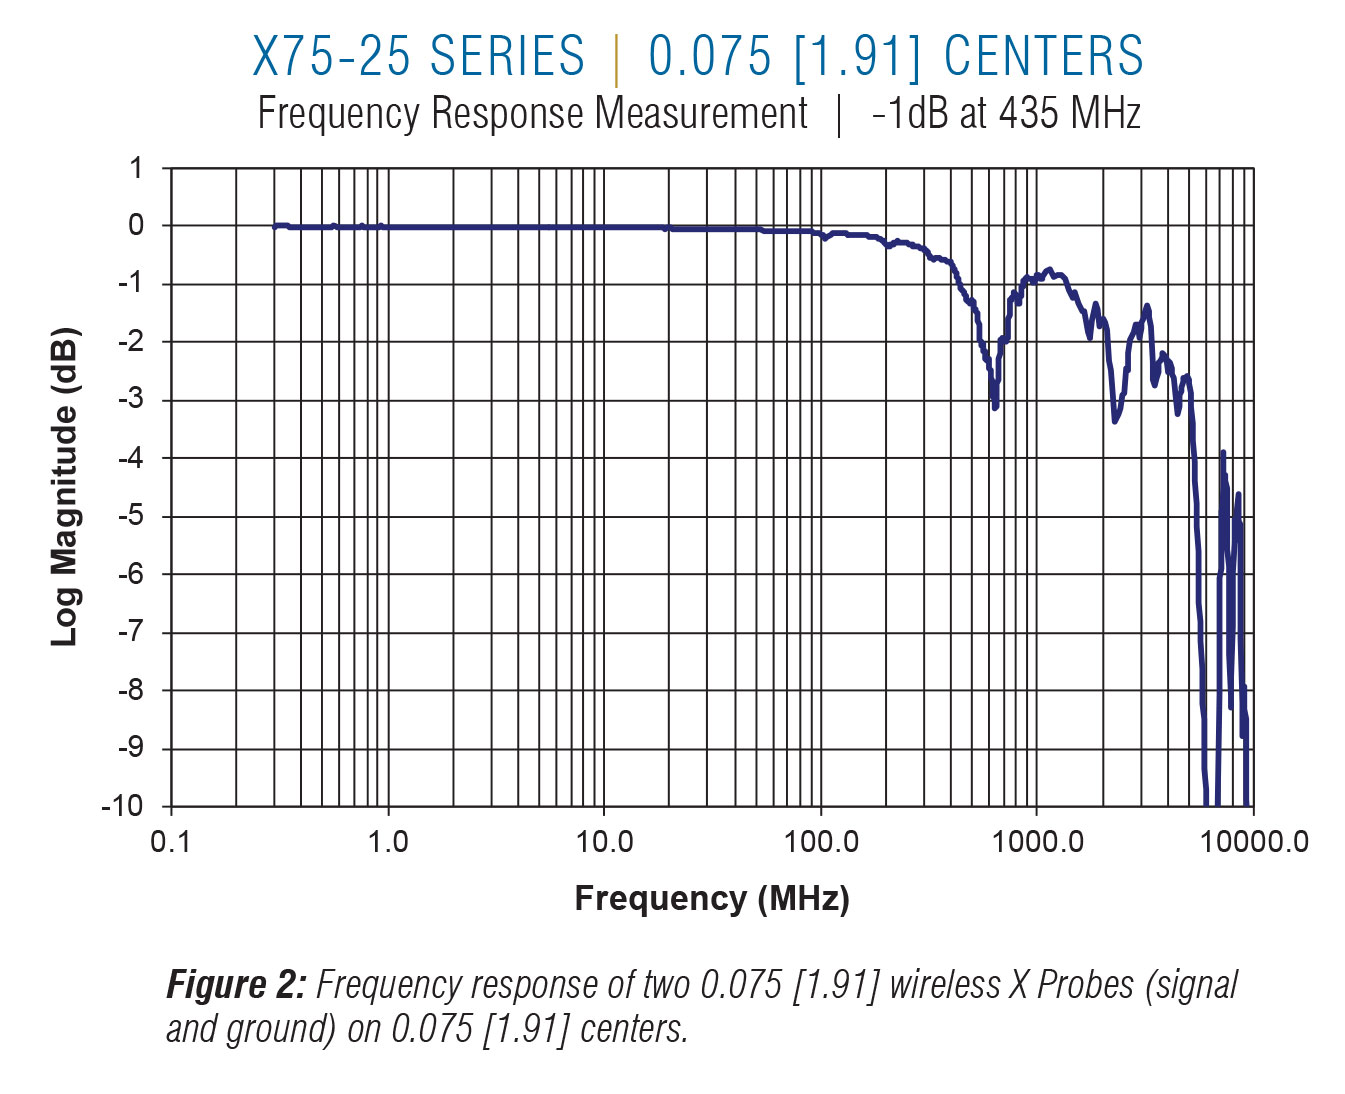
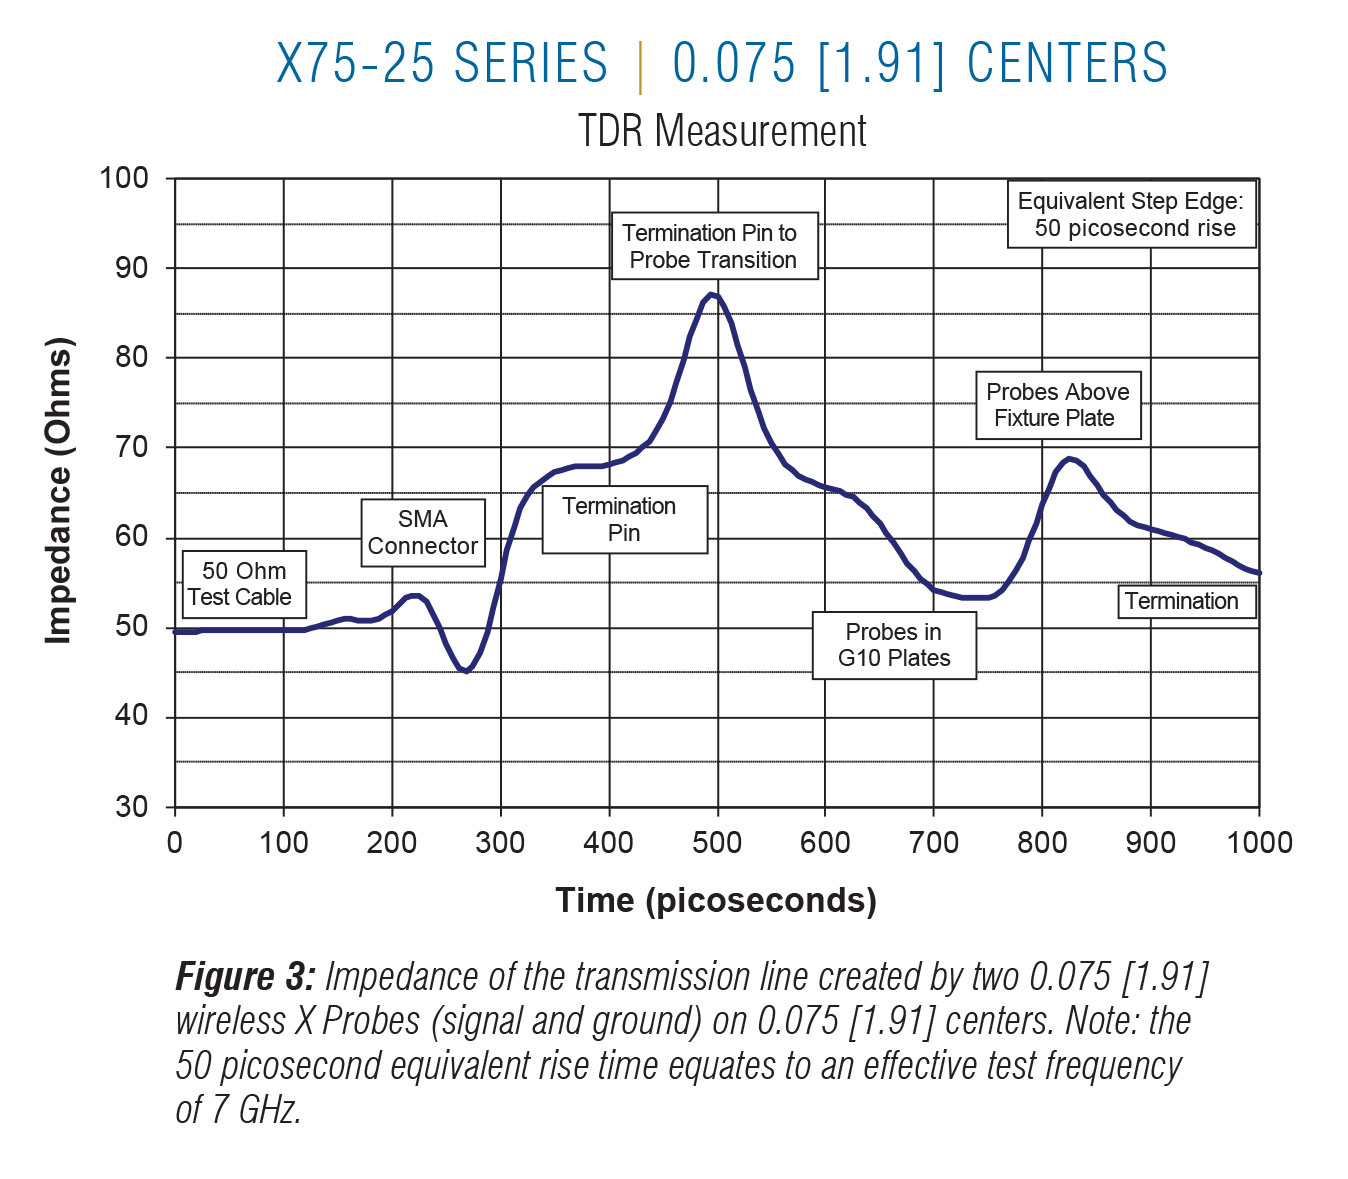
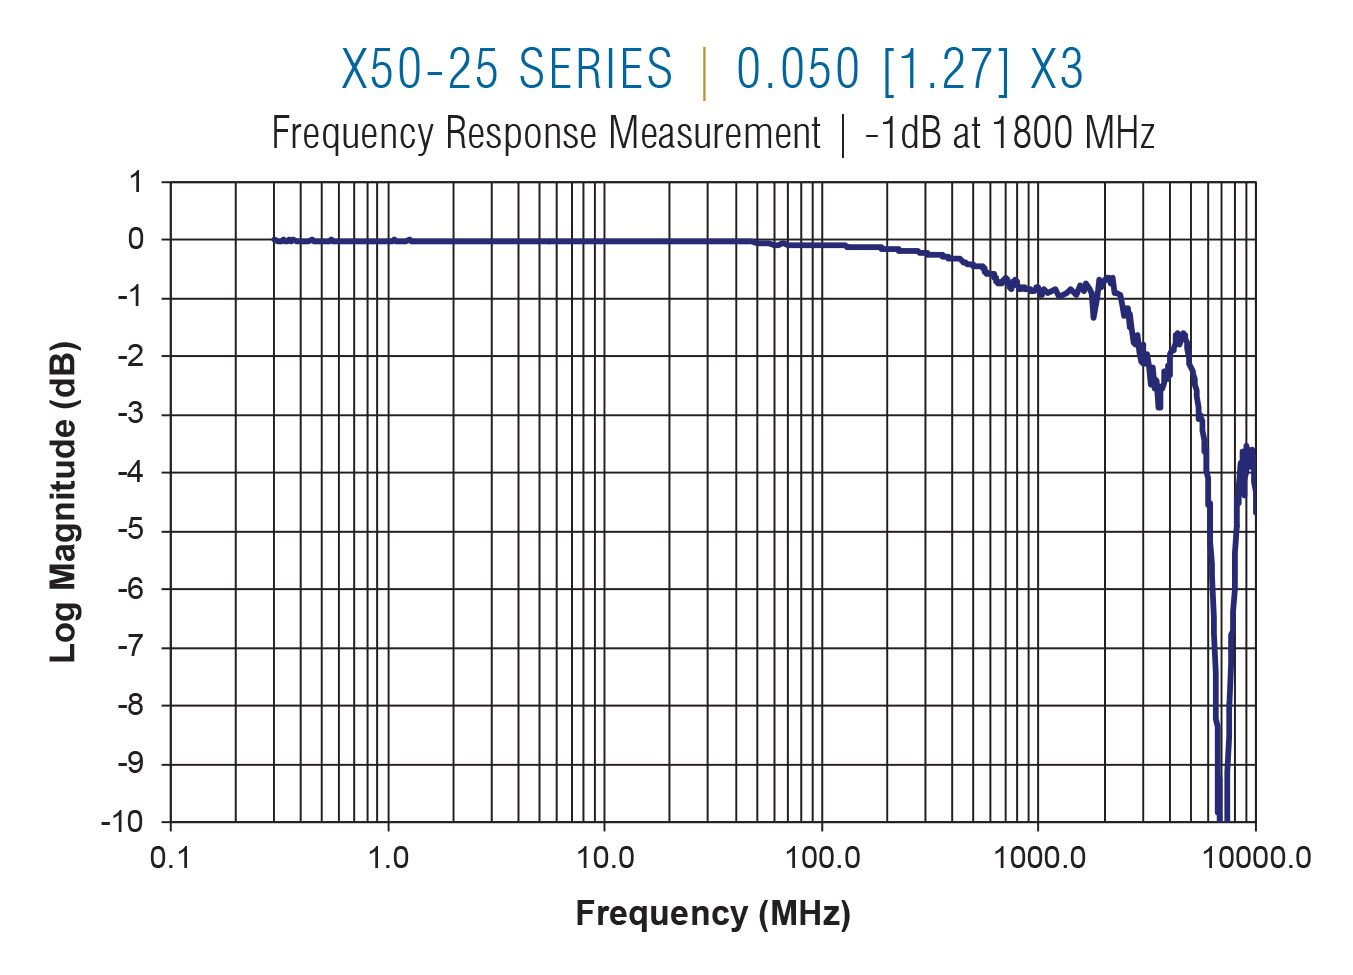
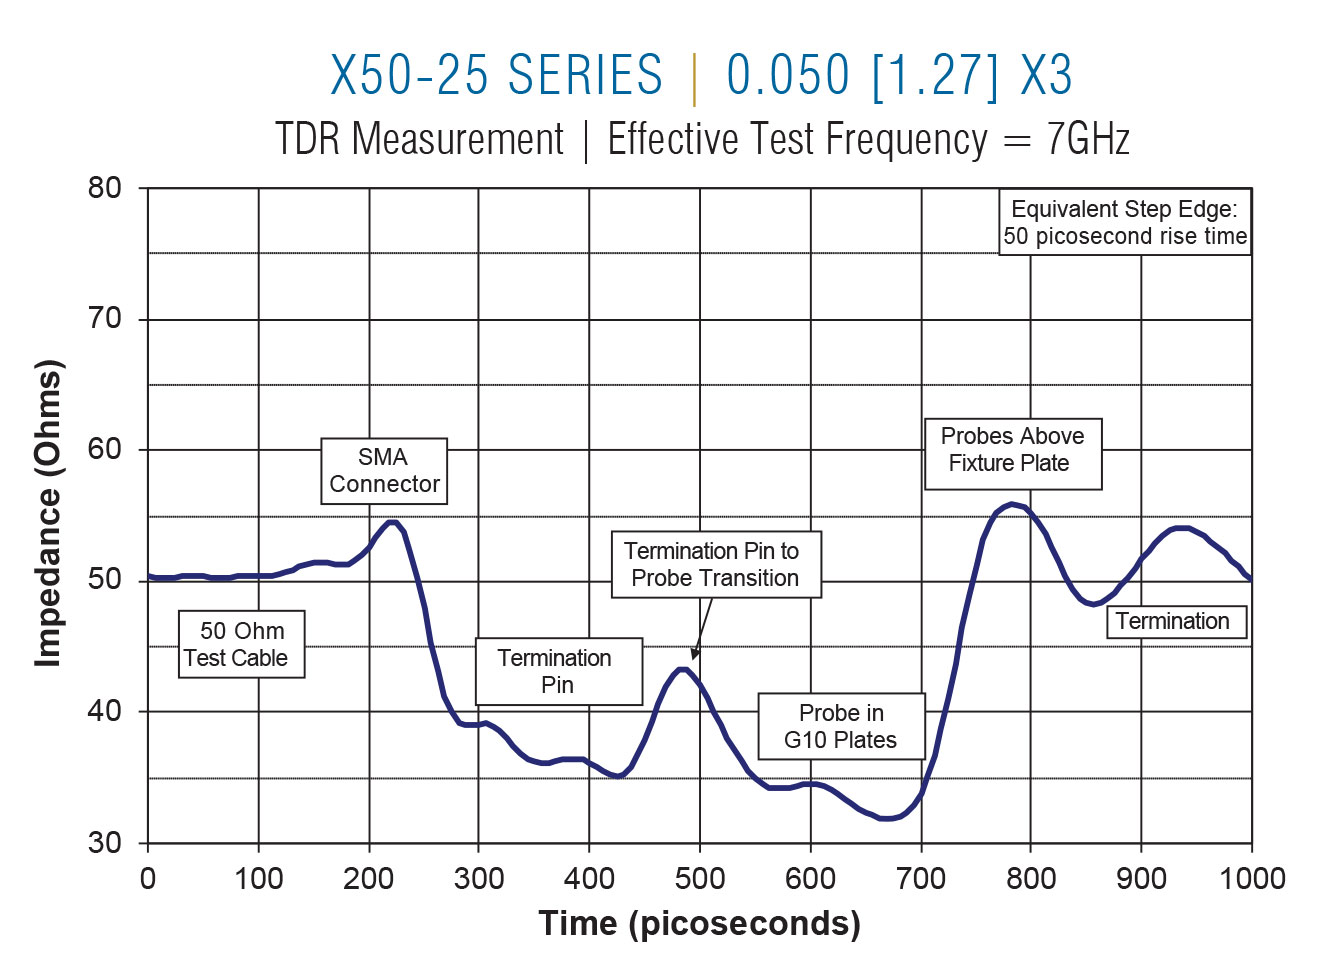
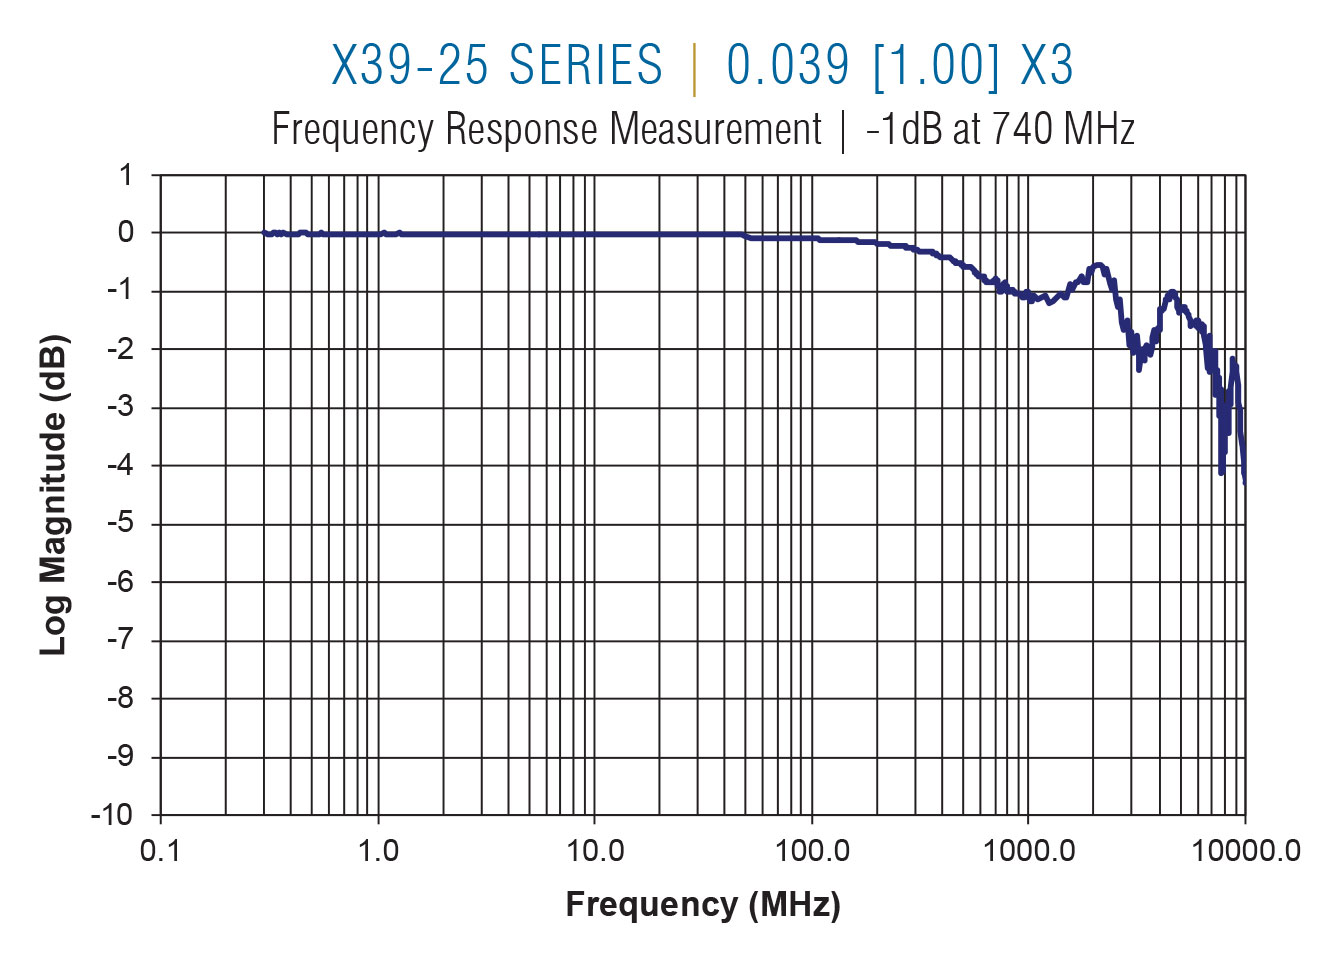
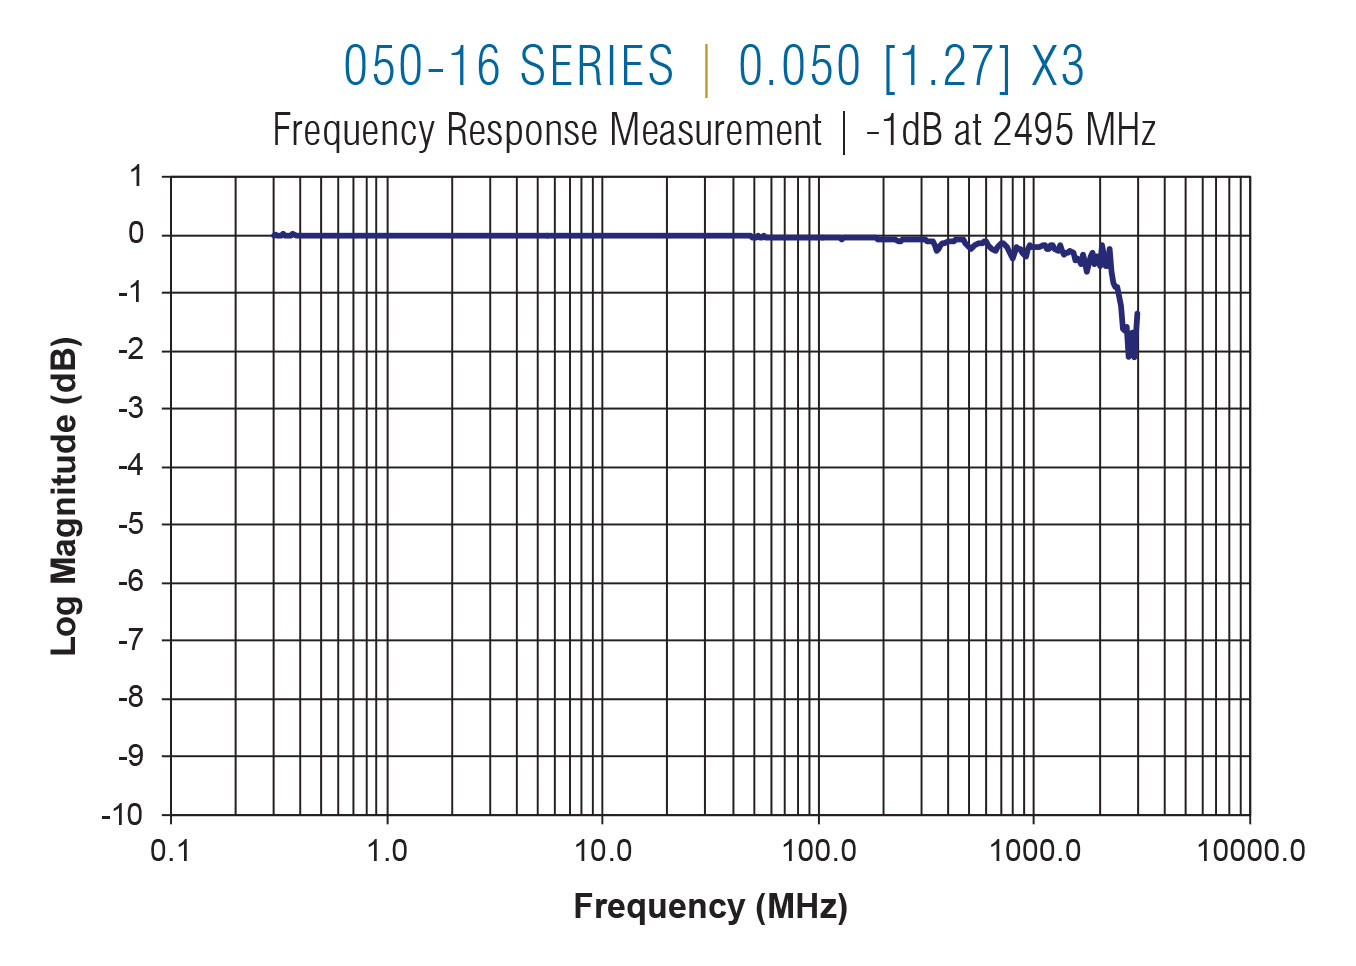
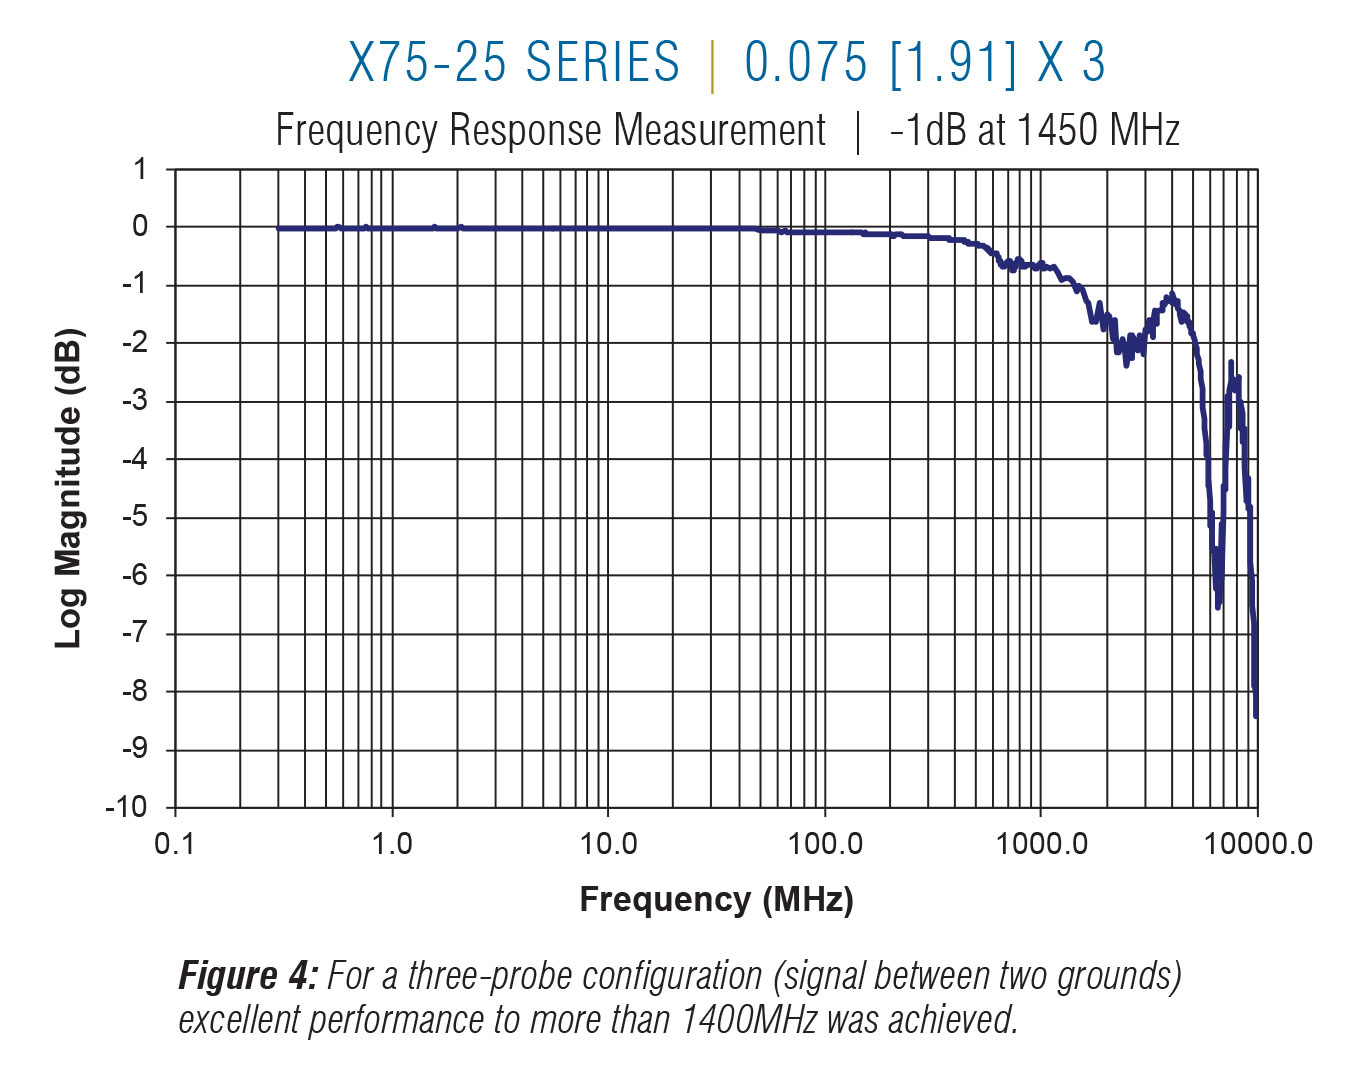
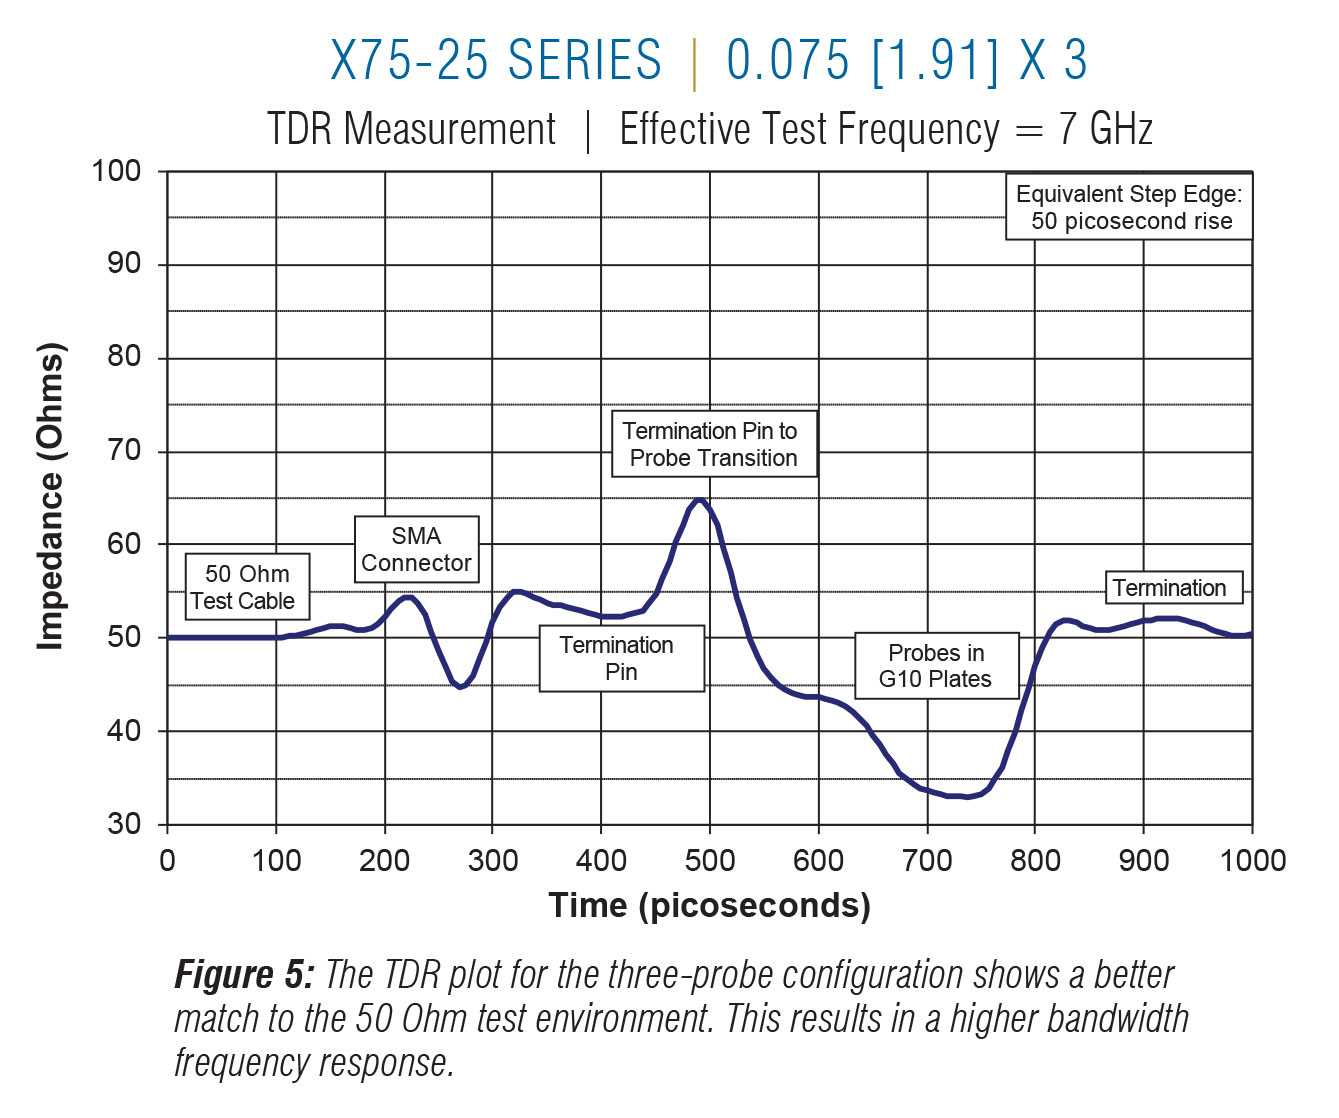
Figure 4 shows the performance of a three-probe in-line configuration on 0.075 [1.91] centers with the signal probe placed between two grounds. Although this configuration may not always be practical, its – 1dB performance to greater than 1400 MHz is excellent. Figure 5 shows the corresponding TDR plot for the same three-probe configuration.
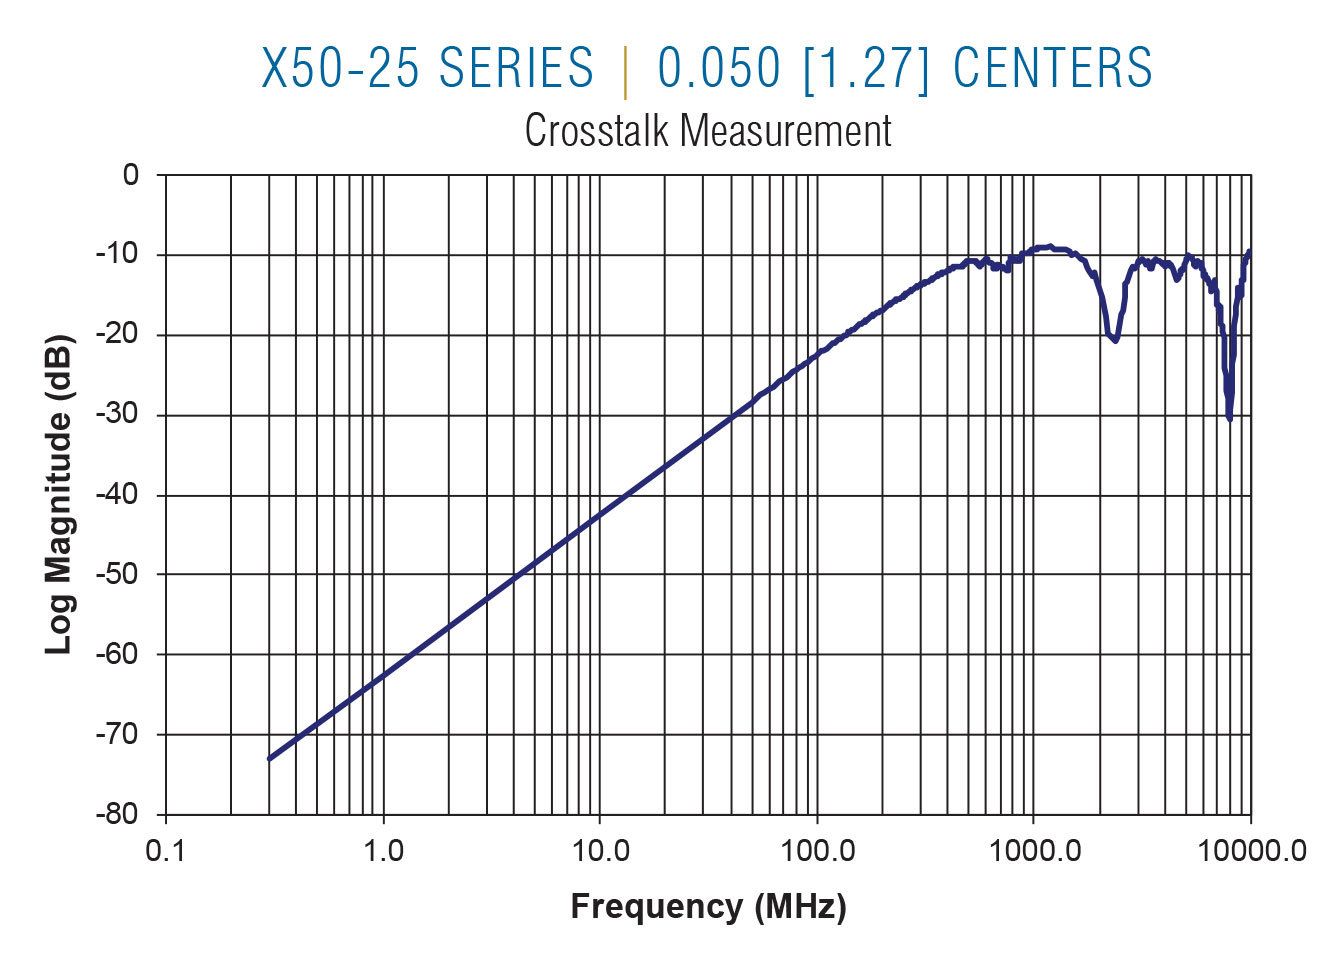
Crosstalk in a conventional fixture is a complex function of many variables: the characteristics of the test signals, the length and type of wiring used, how the wiring is (or isn’t) dressed, and the relative locations of the probes themselves.
Wiring problems are the reason for the existence of wireless probing solutions. Replacing fixture wiring with a translator board provides a more repeatable and controllable environment for routing test signals between the unit under test (UUT) and the test electronics.
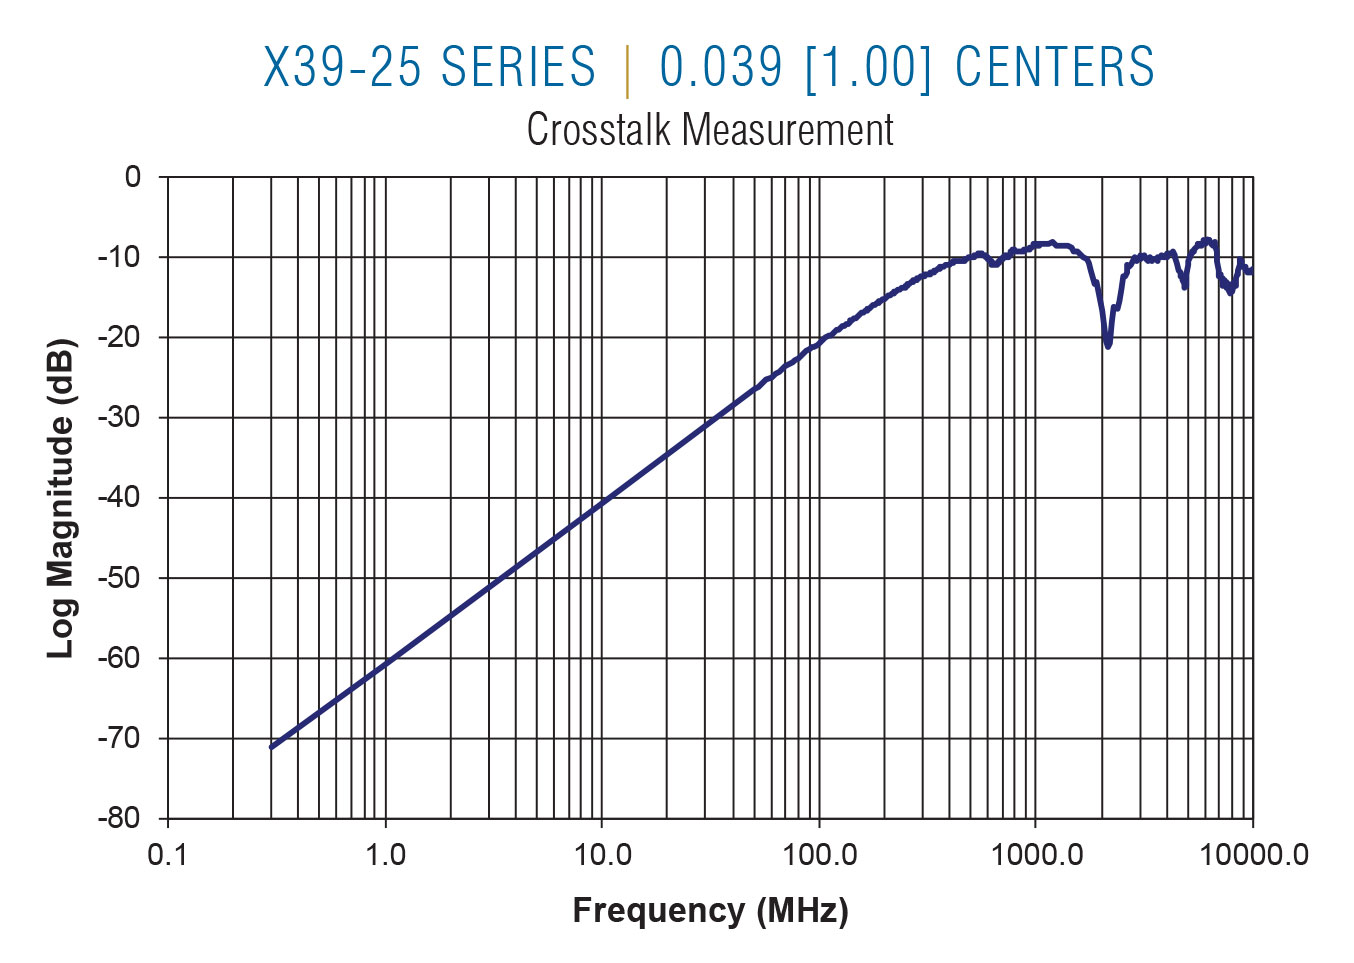
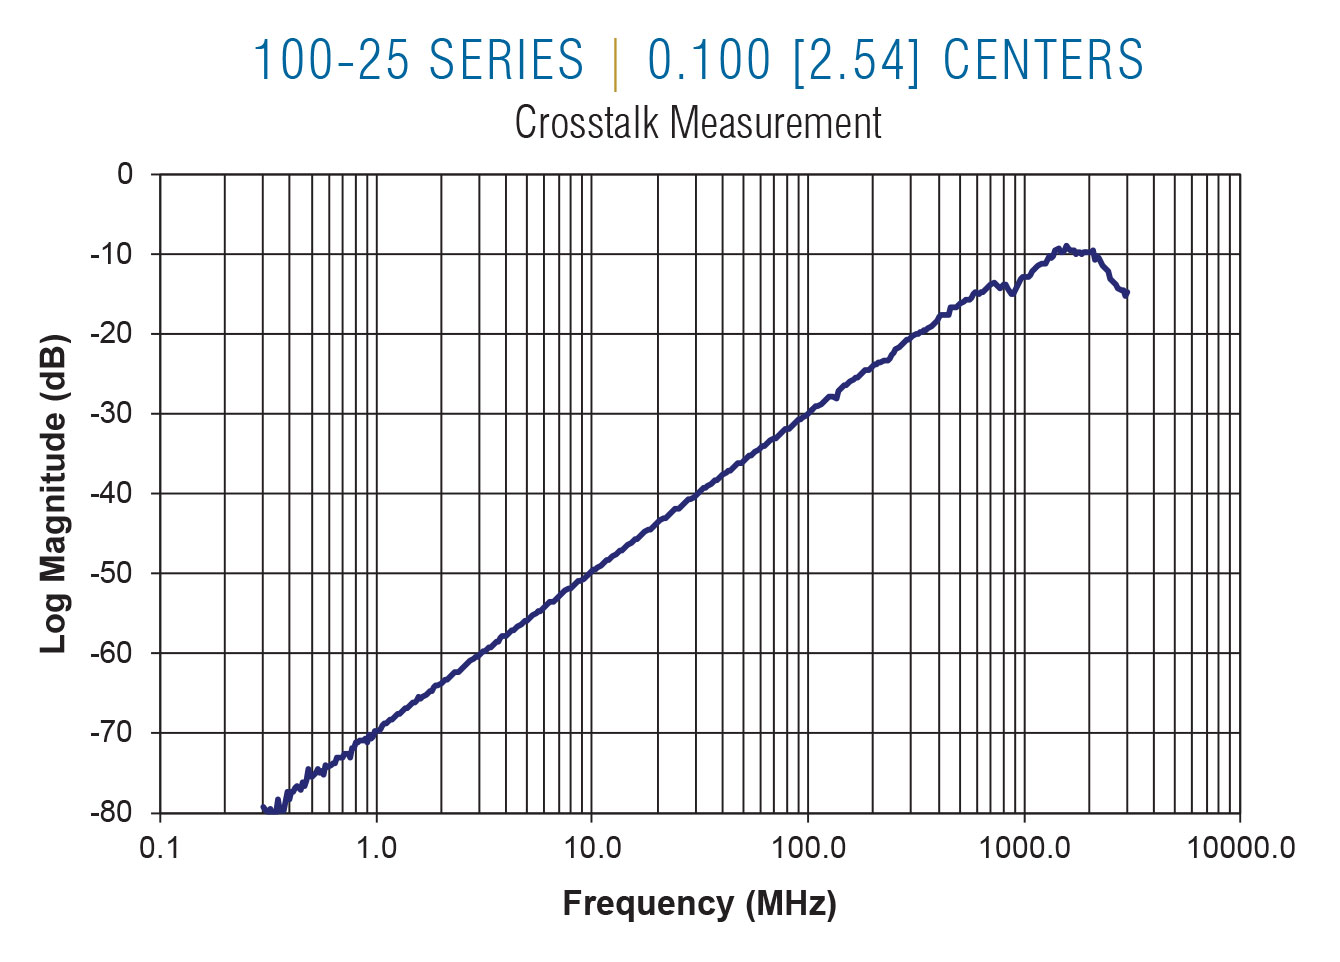
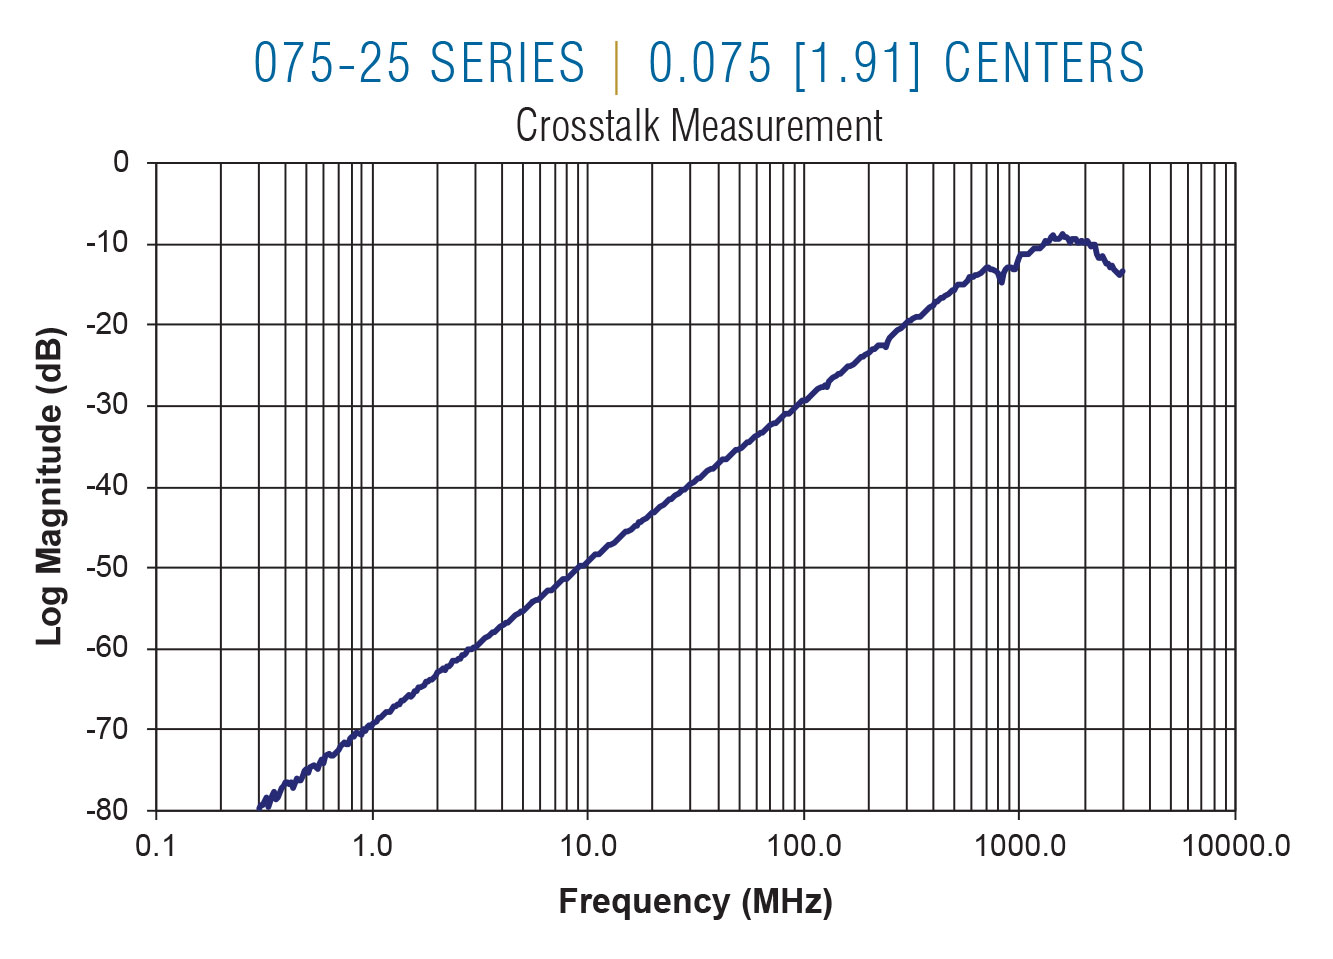
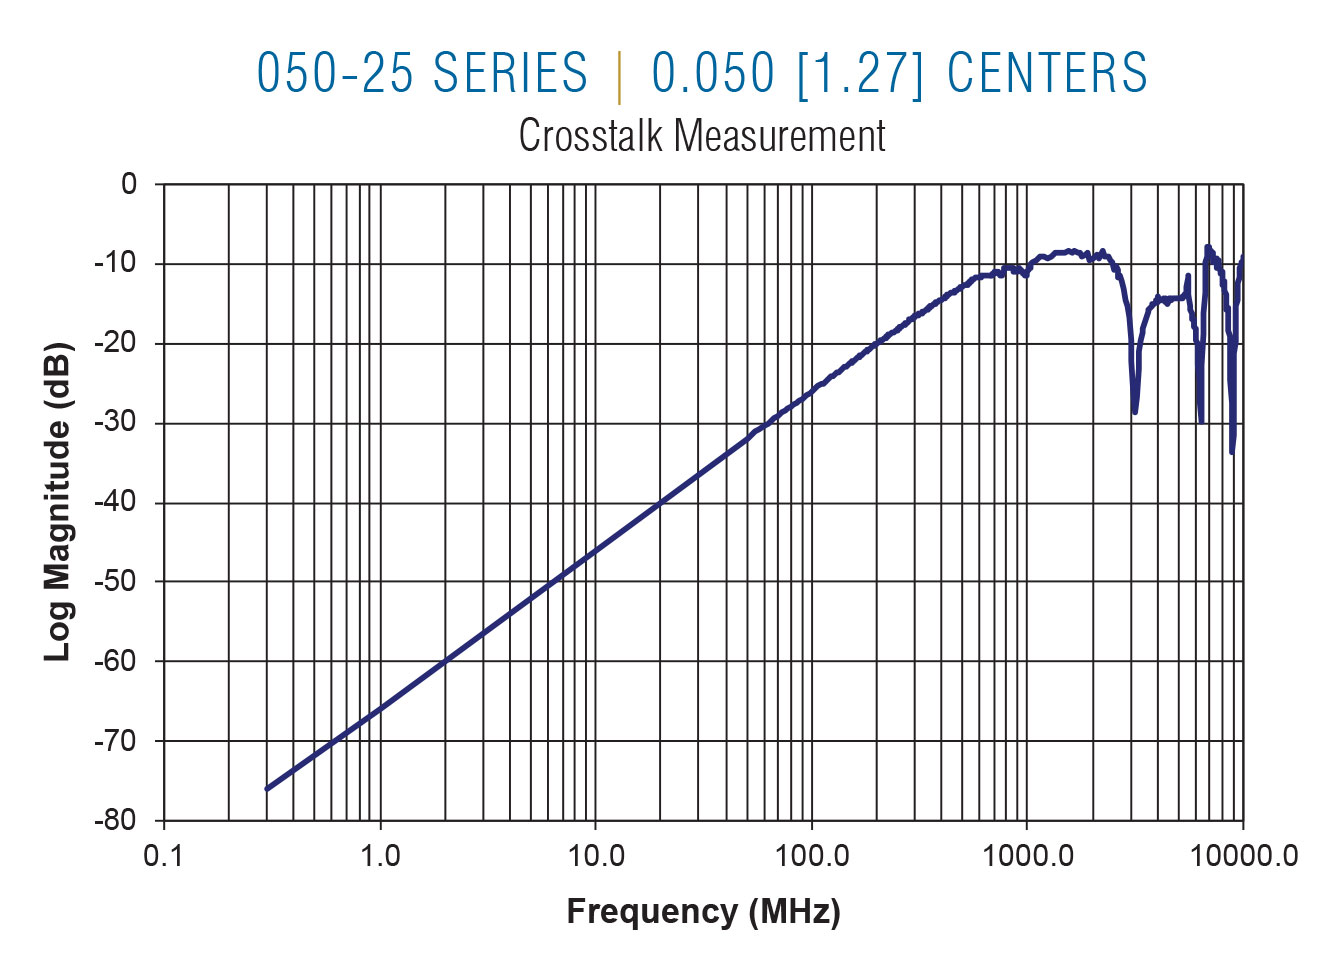
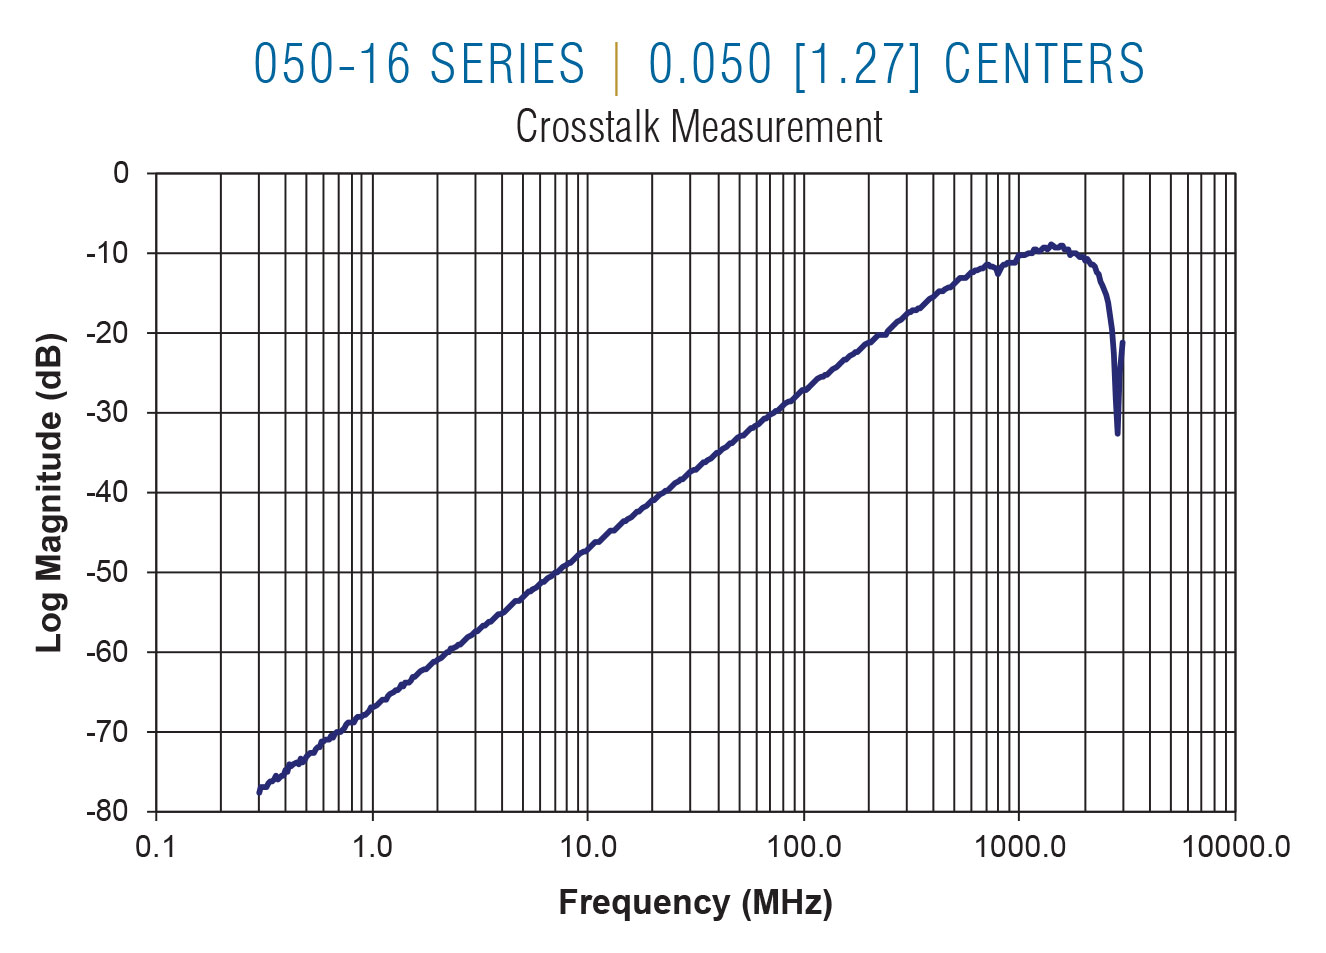
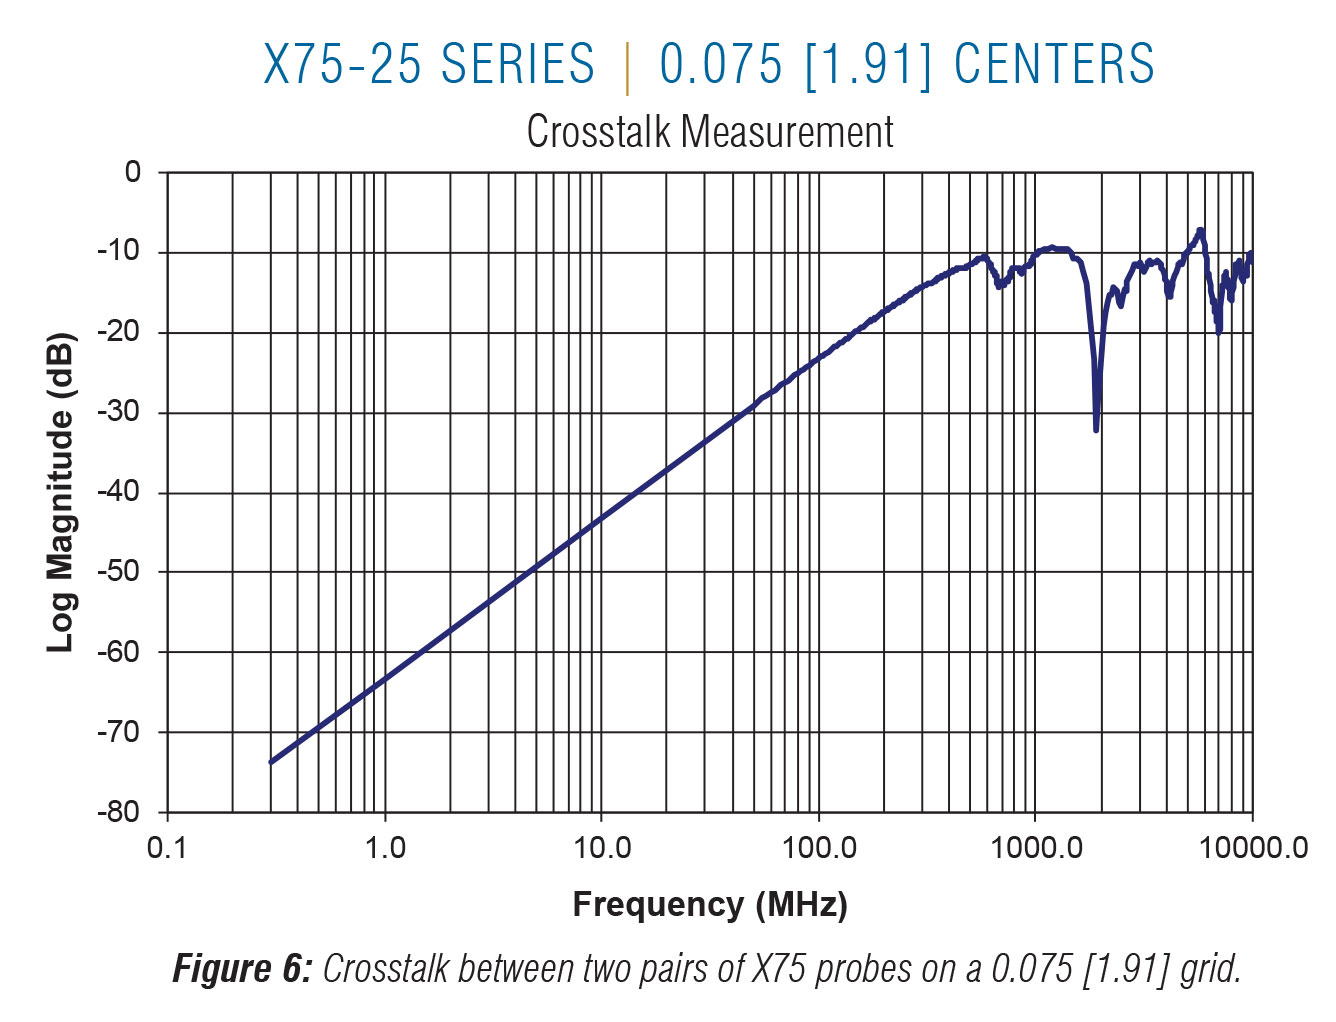
The test signals and probe locations are driven by the needs of the UUT. For reference purposes, a plot of the crosstalk between two pairs of 0.075 [1.91] wireless X Probes on 0.075 [1.91] centers is shown in Figure 6.
A wireless probing solution can deliver excellent high frequency performance. Signal-to-ground probe spacing and the dielectric material separating the probes both play a major role in determining the impedance and the bandwidth of the transmission path. In general, a more constant probe diameter and consistent dielectric material separating the probes makes for fewer impedance changes in the signal path and better overall high frequency performance.
Replacing fixture wiring with a translator board allows the test engineer greater control of length and impedance characteristics of the signal path to the unit under test. This produces cleaner, distortion-free test signals and higher performance testing.
